Buffalo renter households · 2025 research
Buffalo’s small apartment buildings house a substantial share of larger renter households
A household-size cross-tab shows why a rental market cannot be described by apartment totals alone.
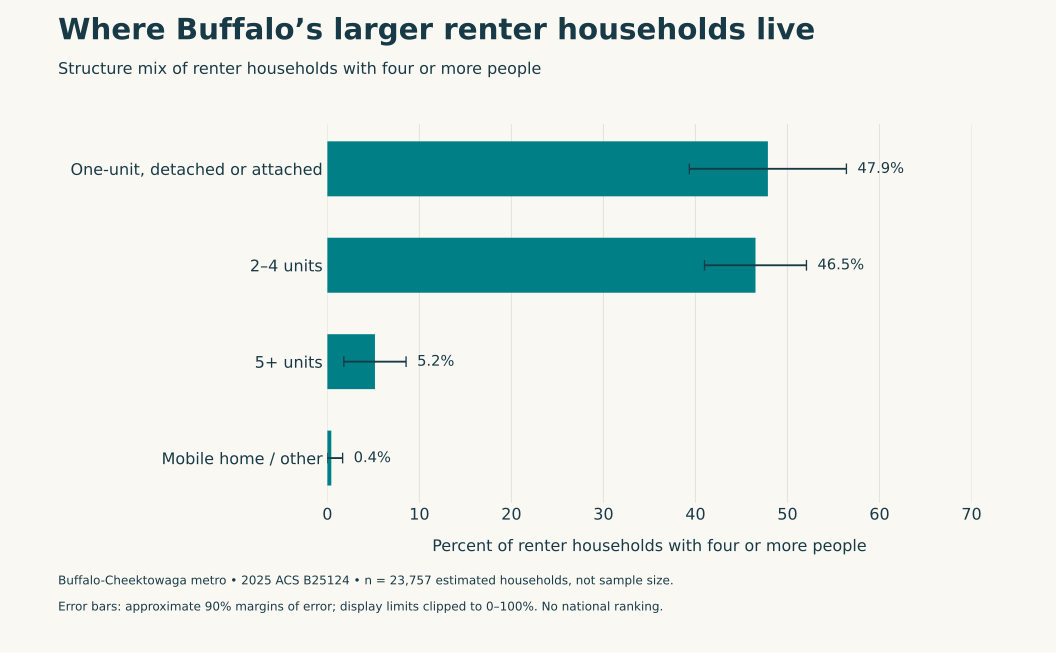
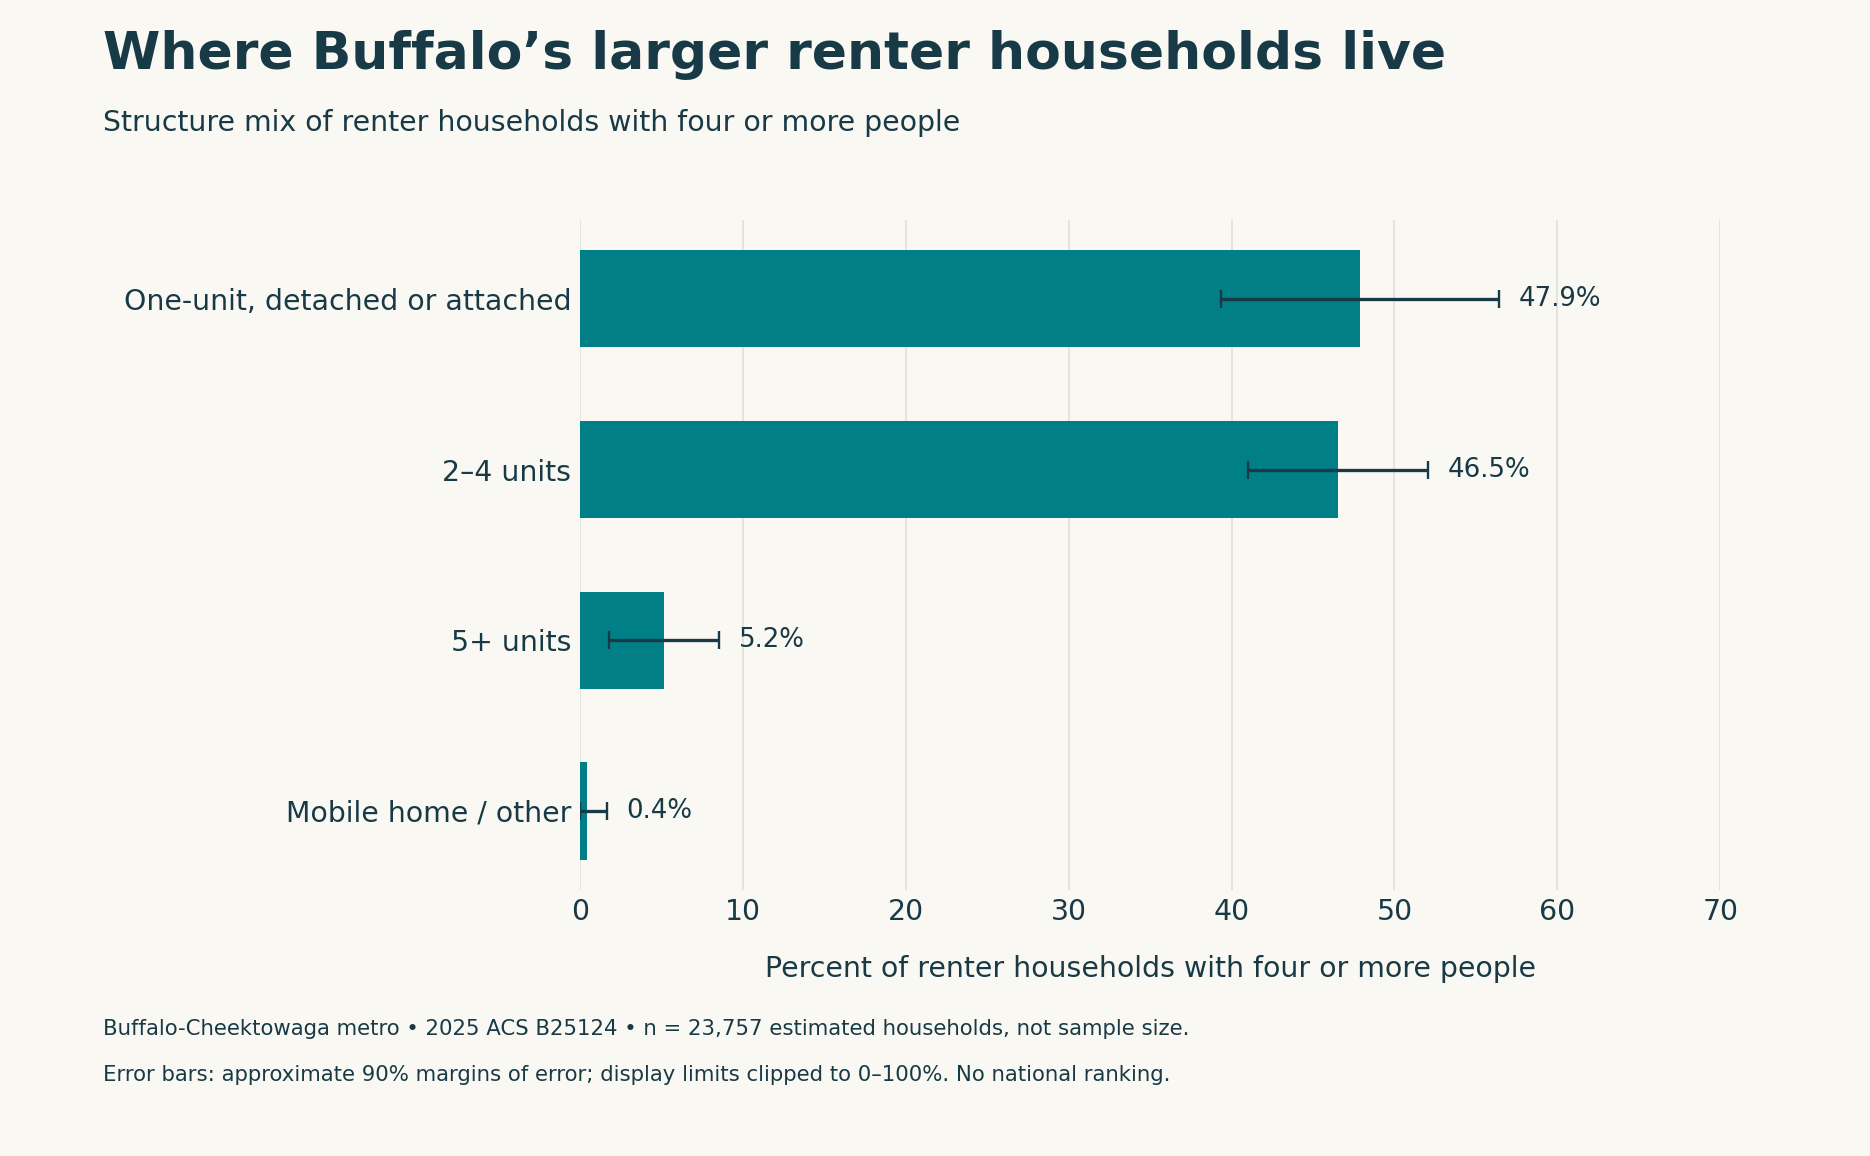
Buildings with two to four housing units accommodated an estimated 11,053 renter households with at least four people in the Buffalo-Cheektowaga metropolitan area in 2025. That was 46.5% of the region’s 23,757 renter households of that size.
One-unit homes, including attached and detached homes, accounted for another 11,373, or 47.9%. The small difference between those two estimates is not a reliable basis for declaring which category houses more. The useful finding is the substantial role of two-to-four-unit buildings—a category that can disappear when a housing discussion divides the market into single-family homes and large apartment developments. Source: 2025 American Community Survey, table B25124.
The estimates do not establish that these households are crowded, that their apartments are appropriately sized or that they would prefer different homes. They show where larger renter households currently live, not where they ought to live.
| Group / category | Estimated units or households | Denominator | Share ± 90% MOE |
|---|---|---|---|
| One-unit, detached or attached | 11,373 | 23,757 | 47.87% ± 8.53 pp |
| 2–4 units | 11,053 | 23,757 | 46.53% ± 5.54 pp |
| 5+ units | 1,229 | 23,757 | 5.17% ± 3.38 pp |
| Mobile home / other | 102 | 23,757 | 0.43% ± 1.23 pp |
Scroll the table horizontally on smaller screens. Full-precision values and definitions are in the chart-data CSV and evidence ZIP.
Household size changes the rental-market picture
The same Census table links housing tenure, household size and units in the building. It therefore permits a direct description of this group, rather than assuming that all renters use the same mix of structures.
Among households with four or more people, an estimated 1,229 rented in buildings with at least five units, or 5.2%. An estimated 102 were in the combined mobile-home, boat, recreational-vehicle, van and other category, or 0.4%; that small estimate is especially uncertain.
The distribution for people renting alone looks different in the point estimates. Of 79,568 one-person renter households, 36,211—or 45.5%—lived in buildings with five or more units. Another 32,004, or 40.2%, occupied units in two-to-four-unit buildings. One-unit homes accounted for 11,149, or 14.0%.
Those comparisons explain why an overall renter count can hide an important planning distinction. A building type that houses many one-person households need not play the same role for households with four or more members. At the same time, household size is not a synonym for family composition. Four adults sharing a home and a household with children can fall in the same category.
One statistical category, several practical questions
The two-to-four-unit category combines duplexes, triplexes and four-unit buildings. It counts occupied rental units and their households, not whole buildings. It cannot reveal how many properties are owner-occupied, how many bedrooms an apartment has or whether a particular landlord lives nearby. Census definitions.
That grouping also does not match every local administrative category. Buffalo’s published landlord resources distinguish requirements for non-owner-occupied single- and double-unit properties from the certificate-of-occupancy process for buildings with three or more units. The metro-wide Census category crosses that distinction and extends beyond the city’s jurisdiction. It should not be treated as a count of properties covered by one Buffalo program. City of Buffalo landlord resources.
This is a practical reason to preserve detail when using housing statistics. A regional analysis can identify the scale of a household-and-building combination. A city inspection record or rental registry can answer a different, address-specific question. Neither dataset should quietly stand in for the other.
For preservation or housing-production discussions, the next step is to ask what this existing stock offers: bedroom mix, rent levels, accessibility, condition and location. The present table does not measure those qualities, determine unmet demand or prove that adding any one building type would lower rents. Its contribution is to show that the occupied housing of larger renter households includes a substantial small-multifamily component.
What the estimates can support
The analysis covers the Buffalo-Cheektowaga, New York metropolitan statistical area, not Buffalo city alone. It uses 2025 ACS one-year estimates, released in 2026, and combines the four-person and five-or-more-person groups.
The two-to-four-unit share has an approximate 90% margin of error of ±5.5 percentage points; the one-unit share has a margin of ±8.5 points. The corresponding household-count margins are about ±2,063 and ±2,604. They do not support a tie, an exact equality or a ranking between those categories.
These are population estimates, not survey sample sizes. The region was selected from an exploratory screen; no national superlative, annual change or simultaneous-confidence claim is made. The full calculation preserves denominators, source cells and uncertainty so readers can distinguish an informative local pattern from a more sweeping claim the data cannot establish.
Methods and interpretation limits
These are 2025 ACS one-year estimates for the named metropolitan areas, not their cities alone. Household estimates are not respondent counts. Sampling and nonsampling errors remain; derived 90% margins use approximate formulas without full covariance.
These examples were selected through exploration. Intervals are descriptive, not adjusted for the broader screen; no national ranking, trend, causal effect, equality or statistically certain majority is claimed. Keep each table’s stated denominator.
This research is separate from the site’s five-year structural housing score. It does not change the score, calculator or source database.
Household size does not establish family composition, crowding or bedroom adequacy. The 2–4-unit and one-unit estimates do not establish either an ordering or equality.
Read the full archived methodology. The evidence ZIP preserves frozen source files, source provenance and reproduction scripts.
Sources and context
Data and chart downloads
The evidence download is shared with the related studies that use the same source files. Keep the original folder layout when extracting it. Source and sensitivity records retained for reproducibility do not constitute additional published stories.