Honolulu required fees · 2025 research
One in four Honolulu metro owner households reported required fees of at least 500 dollars a month
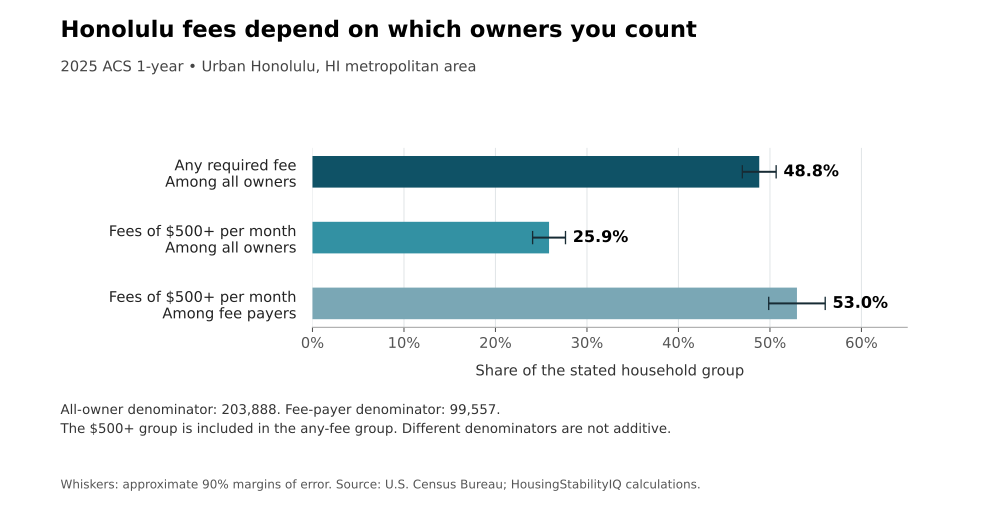
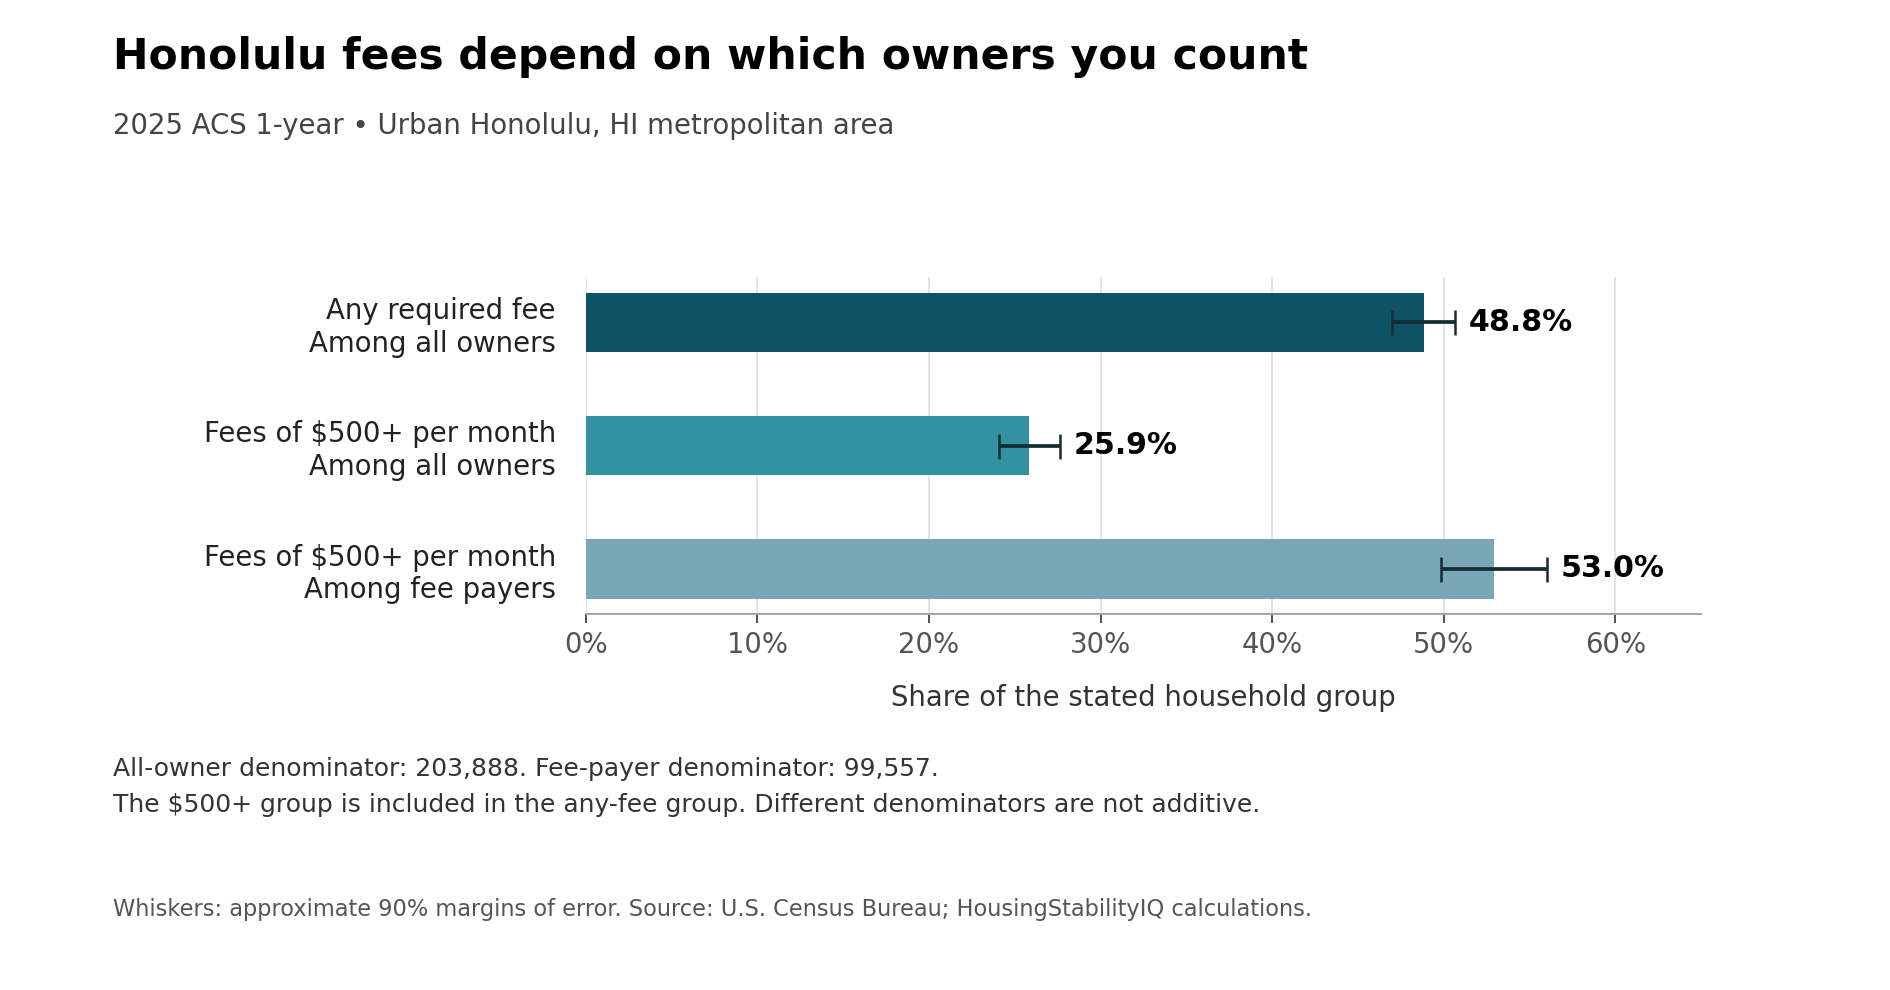
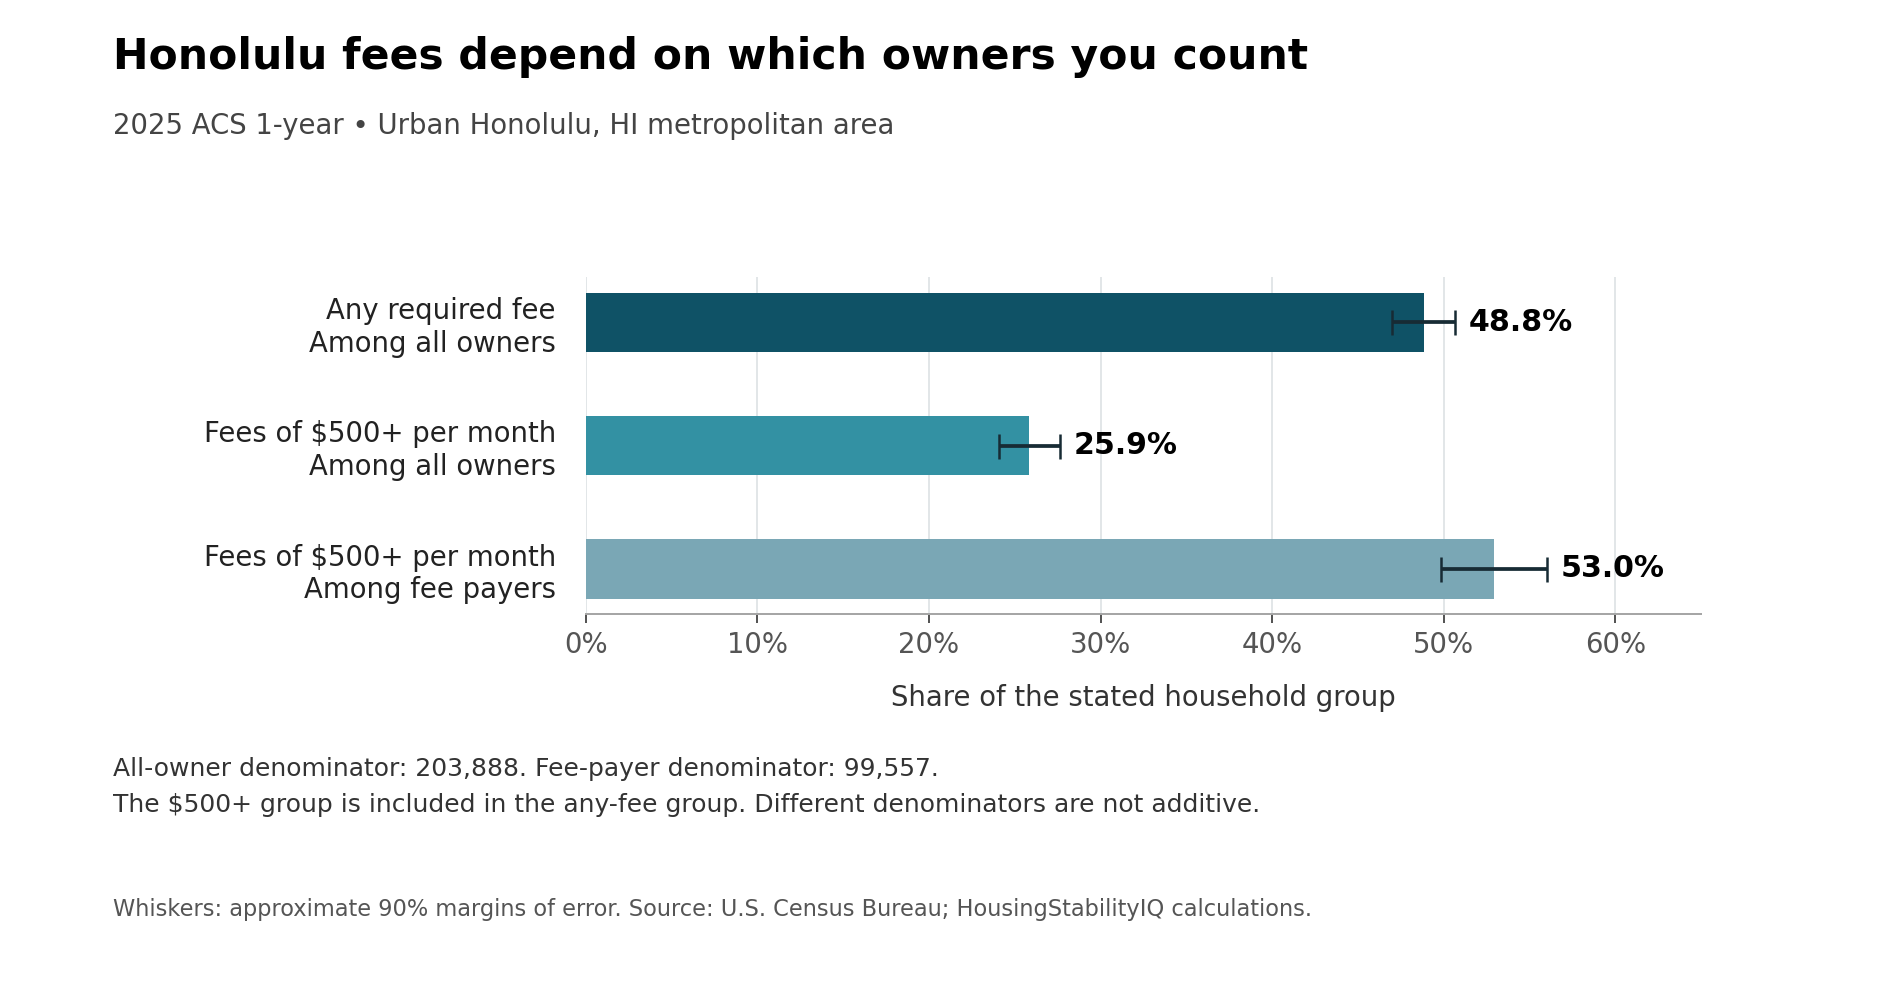
An estimated 52,717 owner households in the Urban Honolulu metropolitan area reported required homeowners association or condominium fees of at least $500 a month in 2025. That was 25.9% of all owner households, according to a HousingStabilityIQ analysis of newly released Census estimates. 2025 ACS table B25142
The denominator is important. The figure does not mean a quarter of fee-paying owners paid that much. It means about a quarter of all 203,888 owner households in the metropolitan area did, including owners reporting no required fee in the comparison group.
An estimated 99,557 households reported any required HOA or condominium fee, or 48.8% of all owners. The $500-or-more households are included within that group. Viewed only among fee payers, the high-fee share is approximately 53%, or about half. This is a second calculation using a smaller denominator, not another group of households to add to the total.
| Group / measure | Estimated households | Denominator | Share ± 90% MOE |
|---|---|---|---|
| Any required fee · all owners | 99,557 | 203,888 | 48.83% ± 1.85 pp |
| $500+ · all owners | 52,717 | 203,888 | 25.86% ± 1.80 pp |
| $500+ · fee payers | 52,717 | 99,557 | 52.95% ± 3.09 pp |
Scroll the table horizontally on smaller screens. Full-precision values and definitions are in the chart-data CSV and evidence ZIP.
The monthly bill is different from a special assessment
The measure captures reported regular monthly fees, not a comprehensive account of special assessments or an association’s financial health. It cannot tell a buyer whether a building has adequate reserves, whether insurance costs explain its fees or whether an unexpected assessment is coming.
Hawaiʻi’s Real Estate Branch explains why reserves are relevant to that separate question: collecting for major repairs and replacements through regular fees can reduce reliance on large special assessments. That guidance helps interpret what the Census table leaves out; it does not establish whether any association in the survey is properly funded. State condominium guidance
The distinction also places the numbers alongside, rather than in competition with, existing reporting. Civil Beat’s September story about the Hawaiian Prince co-op examined a specific building’s fee shock. A regional survey cannot verify that building’s finances, and that building cannot represent every household in the metro. The new analysis supplies a broader count of regular required fees.
Two similar years do not establish a stable trend
The share reporting any fee was 49.2% in 2024 and 48.8% in 2025. The share of all owners reporting at least $500 a month was 25.8% and 25.9%, respectively. Neither difference clears the analysis’s approximate 90% statistical comparison. That is an inconclusive result, not proof that individual households’ bills stayed the same.
The 2025 estimates have approximate 90% margins of error of 1.85 percentage points for any fee and 1.80 points for the $500 threshold among all owners. The fee-payer-only estimate has a margin of about 3.09 points, so it should not be used to claim a statistically certain majority.
Comparisons further back in time need care. Beginning in 2024, Census expanded its questions to include required HOA fees alongside condominium fees. The source combines those types of fees rather than separating them. Census question change The $500 threshold is nominal, not inflation-adjusted. Census also reports a six-week disruption to 2025 collection. Collection note
The defensible takeaway is about prevalence and scale, not a new explanation for rising costs: regular required fees reach at least $500 for roughly one in four owner households in the metro. Evaluating a particular property still requires its own budget, fee schedule and reserve information; the regional estimate cannot substitute for those records.
Methods and interpretation limits
These are ACS one-year research estimates, separate from HousingStabilityIQ’s five-year scores. Approximate 90% margins of error use the Census subset-proportion formula and root-sum-of-squares for component sums or differences; covariance is unavailable. Sampling uncertainty does not include every reporting, coverage or processing error.
Census reports a six-week interruption to 2025 collection, changes to population controls and changes to disclosure processing. These limitations accompany the estimates. The owner-cost and required-fee comparisons retain the original 12-test family and the 2024 questionnaire change. An inconclusive annual comparison is not proof of no change.
Read the full archived methodology. The evidence ZIP preserves frozen source files, source provenance and reproduction scripts.
Sources and context
Data and chart downloads
The evidence download is shared with the related studies that use the same source files. Keep the original folder layout when extracting it. Source and sensitivity records retained for reproducibility do not constitute additional published stories.