Original county research · Census Vintage 2025
Housing Stock and Population Growth, 2020–2025: Florida, Georgia and North Carolina
Housing stock grew faster than population statewide—but 102 counties moved the other way.
By HousingStabilityIQ · Published · Sources retrieved October 23, 2026
This comparison measures people and housing units, including vacant and seasonal homes. It does not measure housing need or affordability, explain rents, or update the Housing Stability Score. Permits are authorizations, not completions.
From July 2020 to July 2025, housing-unit estimates increased faster than population estimates in Florida, Georgia, and North Carolina as a whole. The county picture was less uniform: population grew faster than housing stock in 102 of the three states’ 326 counties.
Those 102 counties were all gaining population. The comparison therefore separates a growing county’s stock/population pattern from a county where fewer residents can produce a higher number of housing units per person.
HousingStabilityIQ calculated the differences from freshly retrieved U.S. Census Bureau Vintage 2025 estimates, matching the same July 1 dates and county boundaries. The study also places calendar-year 2025 building permits alongside the five-year comparison. It measures changes in people and housing units—not the number of homes needed, household formation, rents, or affordability.
| State | Housing units, 2020–25 | Population, 2020–25 | Housing growth minus population growth | Counties where population grew faster | Of counties gaining population |
|---|---|---|---|---|---|
| Florida | +8.98% | +8.67% | +0.31 percentage points | 33 of 67 | 33 of 63 |
| Georgia | +7.04% | +5.31% | +1.72 percentage points | 44 of 159 | 44 of 121 |
| North Carolina | +9.27% | +7.16% | +2.11 percentage points | 25 of 100 | 25 of 87 |
State rates use summed counts, not averages of county growth rates. Percentage-point differences are calculated before rounding. Source: Census housing-unit estimates and county population estimates, Vintage 2025; calculations by HousingStabilityIQ.
Florida: the statewide near-match conceals different county paths
Florida added an estimated 888,781 housing units and 1,871,193 residents between July 2020 and July 2025. Housing-unit growth of 8.98% was just 0.31 percentage points above population growth of 8.67%. Yet population grew faster than housing stock in 33 counties—more than half of the 63 counties that gained residents.
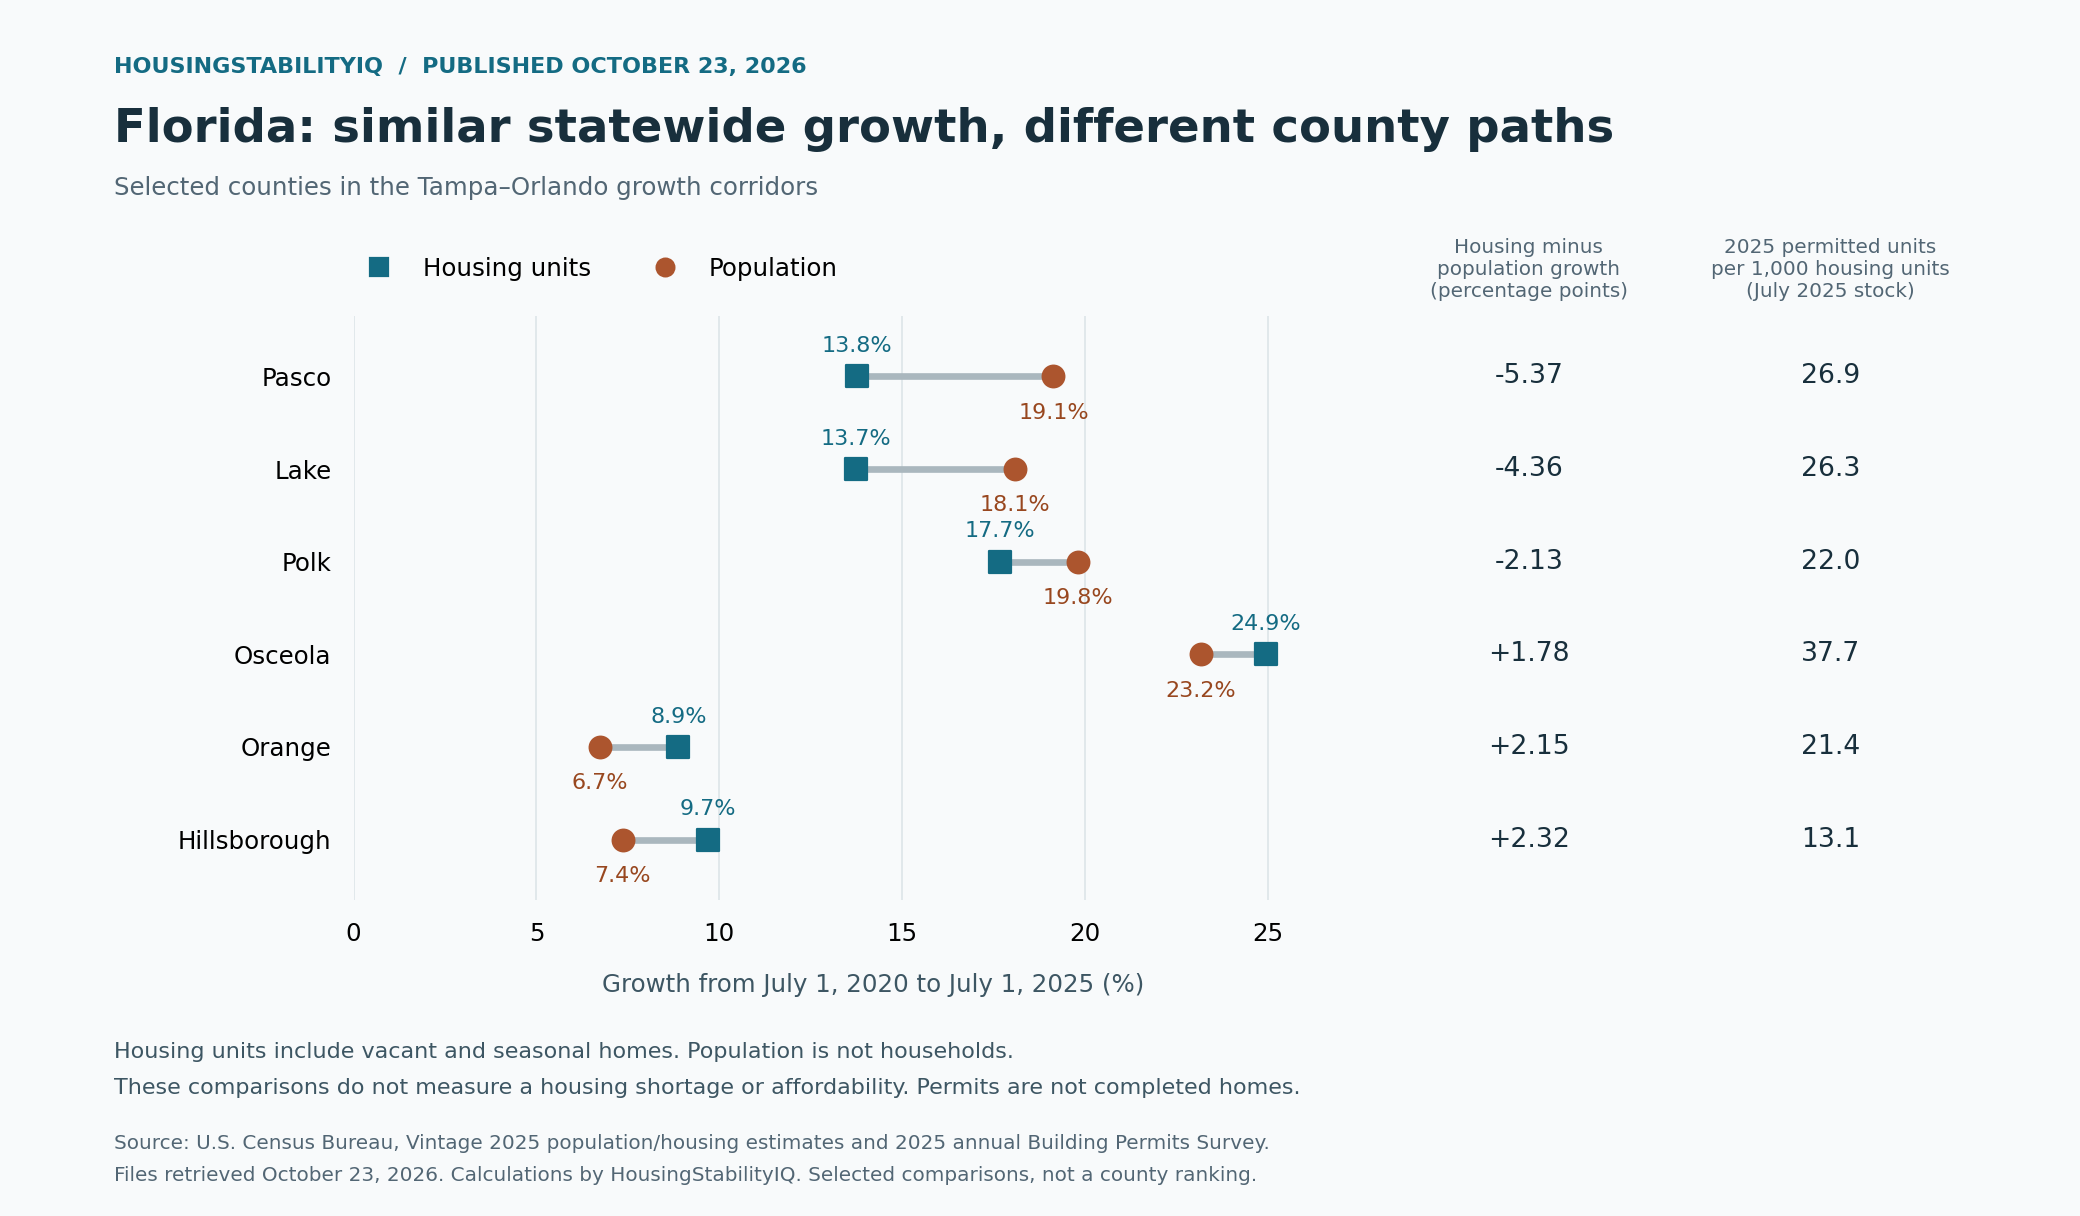
Pasco illustrates the distinction. Its population increased 19.14%, while housing units increased 13.77%, a difference of −5.37 percentage points when housing growth is measured against population growth. Lake and Polk also had faster population than housing-unit growth. In Osceola, Orange, and Hillsborough, the order was reversed.
This is more informative than treating all fast-growing counties as one housing story. Osceola’s housing stock increased 24.94%, faster than its population increase of 23.16%; nearby Polk’s housing stock increased 17.68%, behind its population increase of 19.81%.
The 2025 permits data provide a separate measure of authorized construction activity. Pasco recorded 26.85 permitted units per 1,000 July 2025 housing units; Osceola recorded 37.65. Those annual authorizations cannot be added to the July housing estimate or treated as completed homes.
| County | FIPS | Housing growth | Population growth | Difference (pp) | 2025 permits / 1,000 homes |
|---|---|---|---|---|---|
| Pasco County | 12101 | 13.77% | 19.14% | -5.37 | 26.85 |
| Lake County | 12069 | 13.72% | 18.08% | -4.36 | 26.32 |
| Polk County | 12105 | 17.68% | 19.81% | -2.13 | 21.98 |
| Osceola County | 12097 | 24.94% | 23.16% | +1.78 | 37.65 |
| Orange County | 12095 | 8.88% | 6.73% | +2.15 | 21.39 |
| Hillsborough County | 12057 | 9.68% | 7.36% | +2.32 | 13.08 |
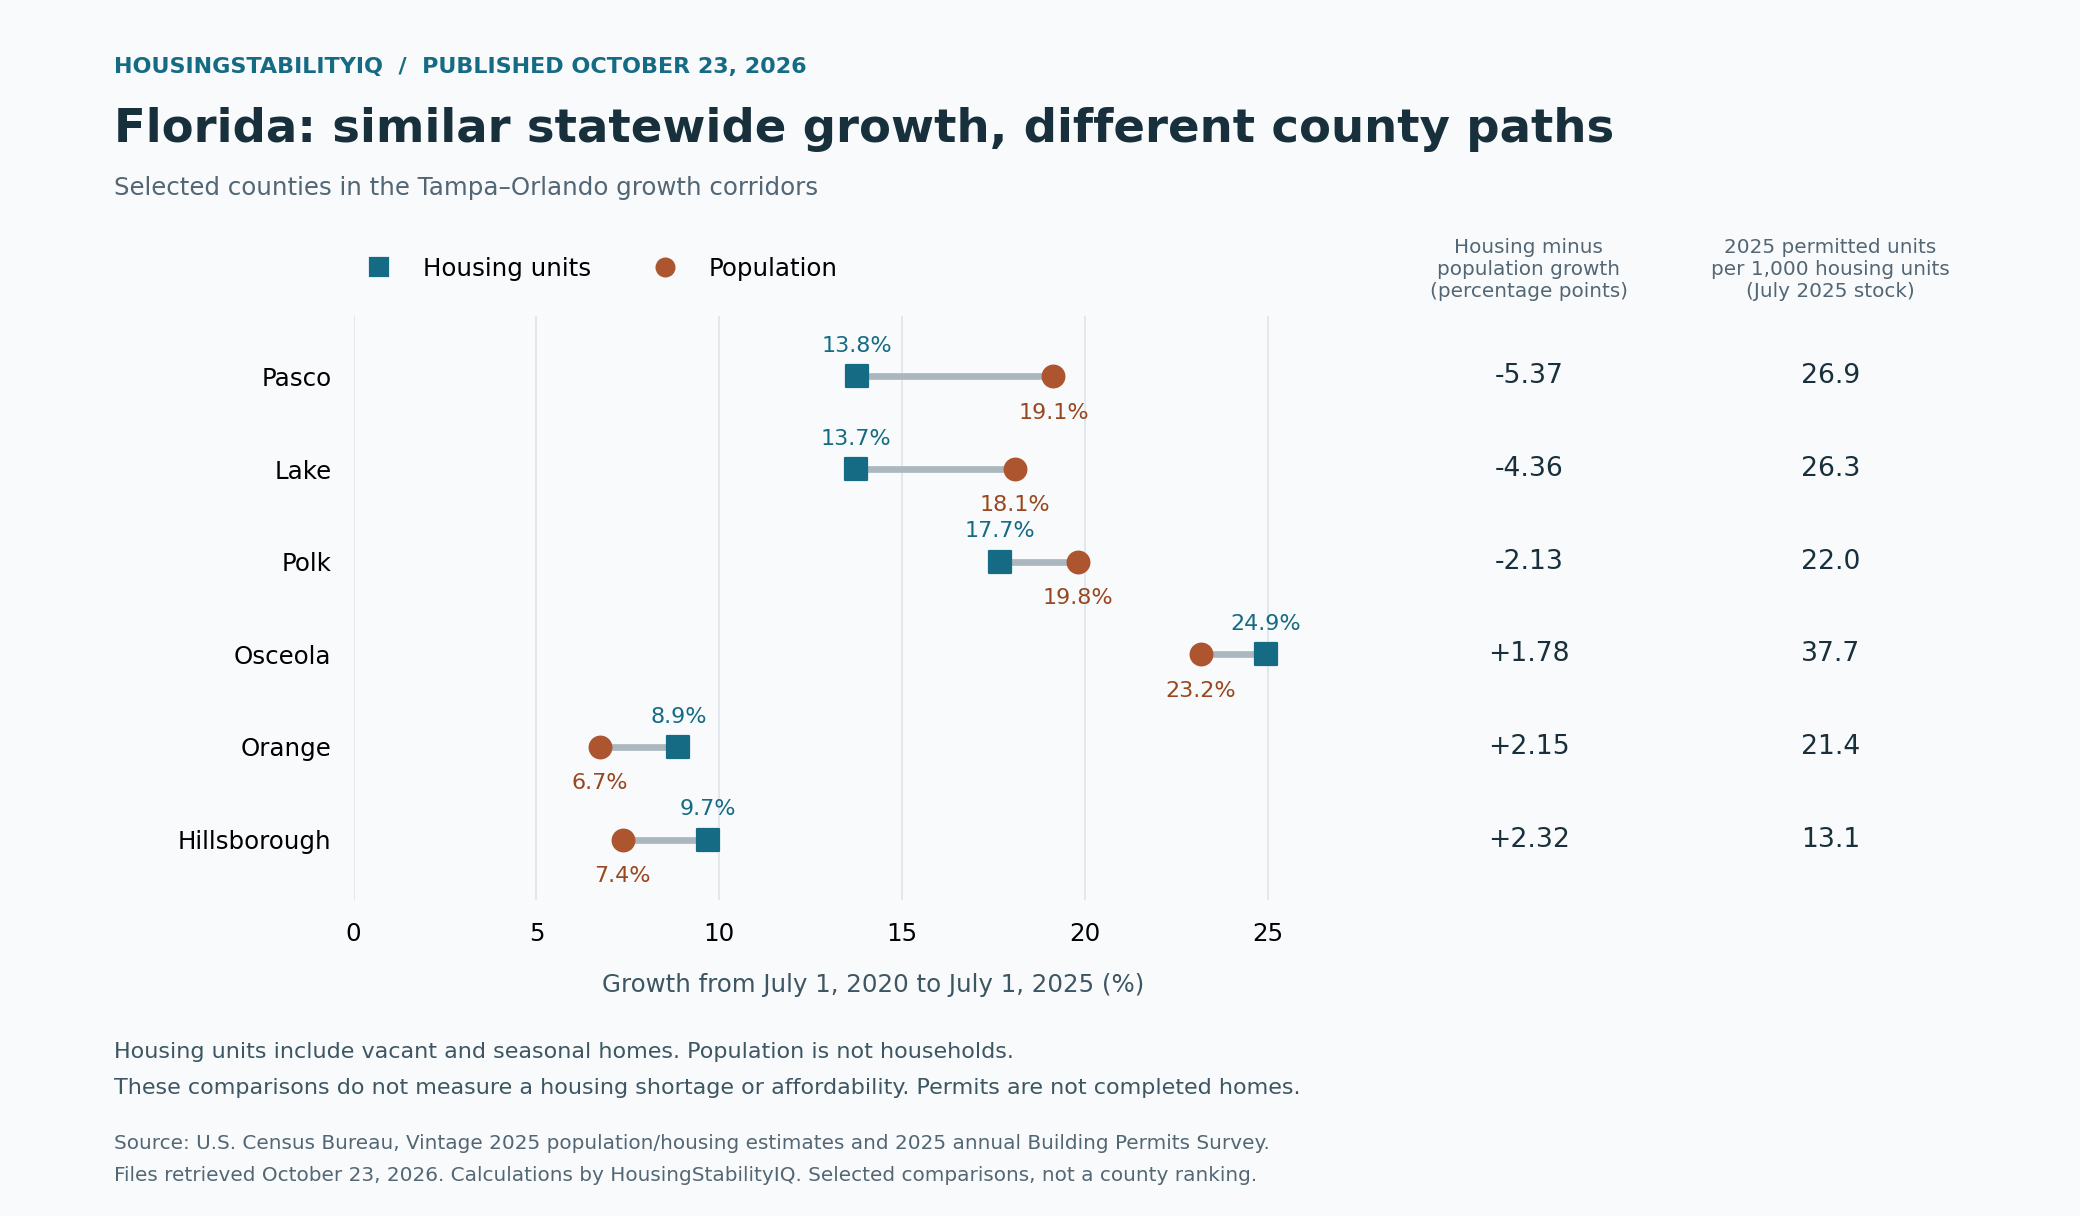
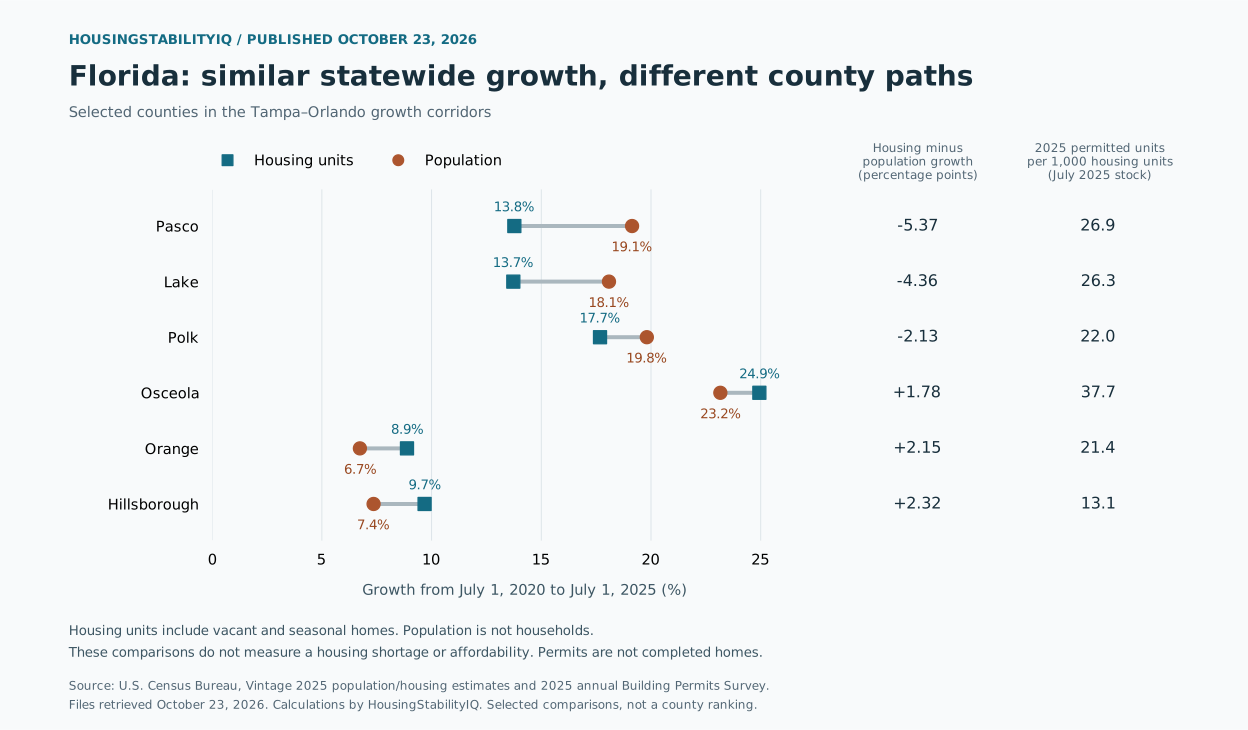
The chart selects Pasco, Lake, Polk, Osceola, Orange, and Hillsborough counties to show contrasting paths within the Tampa–Orlando growth corridors. It does not represent complete metropolitan areas, statewide extremes, or a representative sample. All 67 Florida counties are included in the downloadable analysis.
Georgia: Dawson’s recent permit activity sits beside a five-year population lead
Georgia’s statewide housing-unit growth exceeded population growth by 1.72 percentage points. But 44 of its 121 population-growing counties had the opposite pattern.
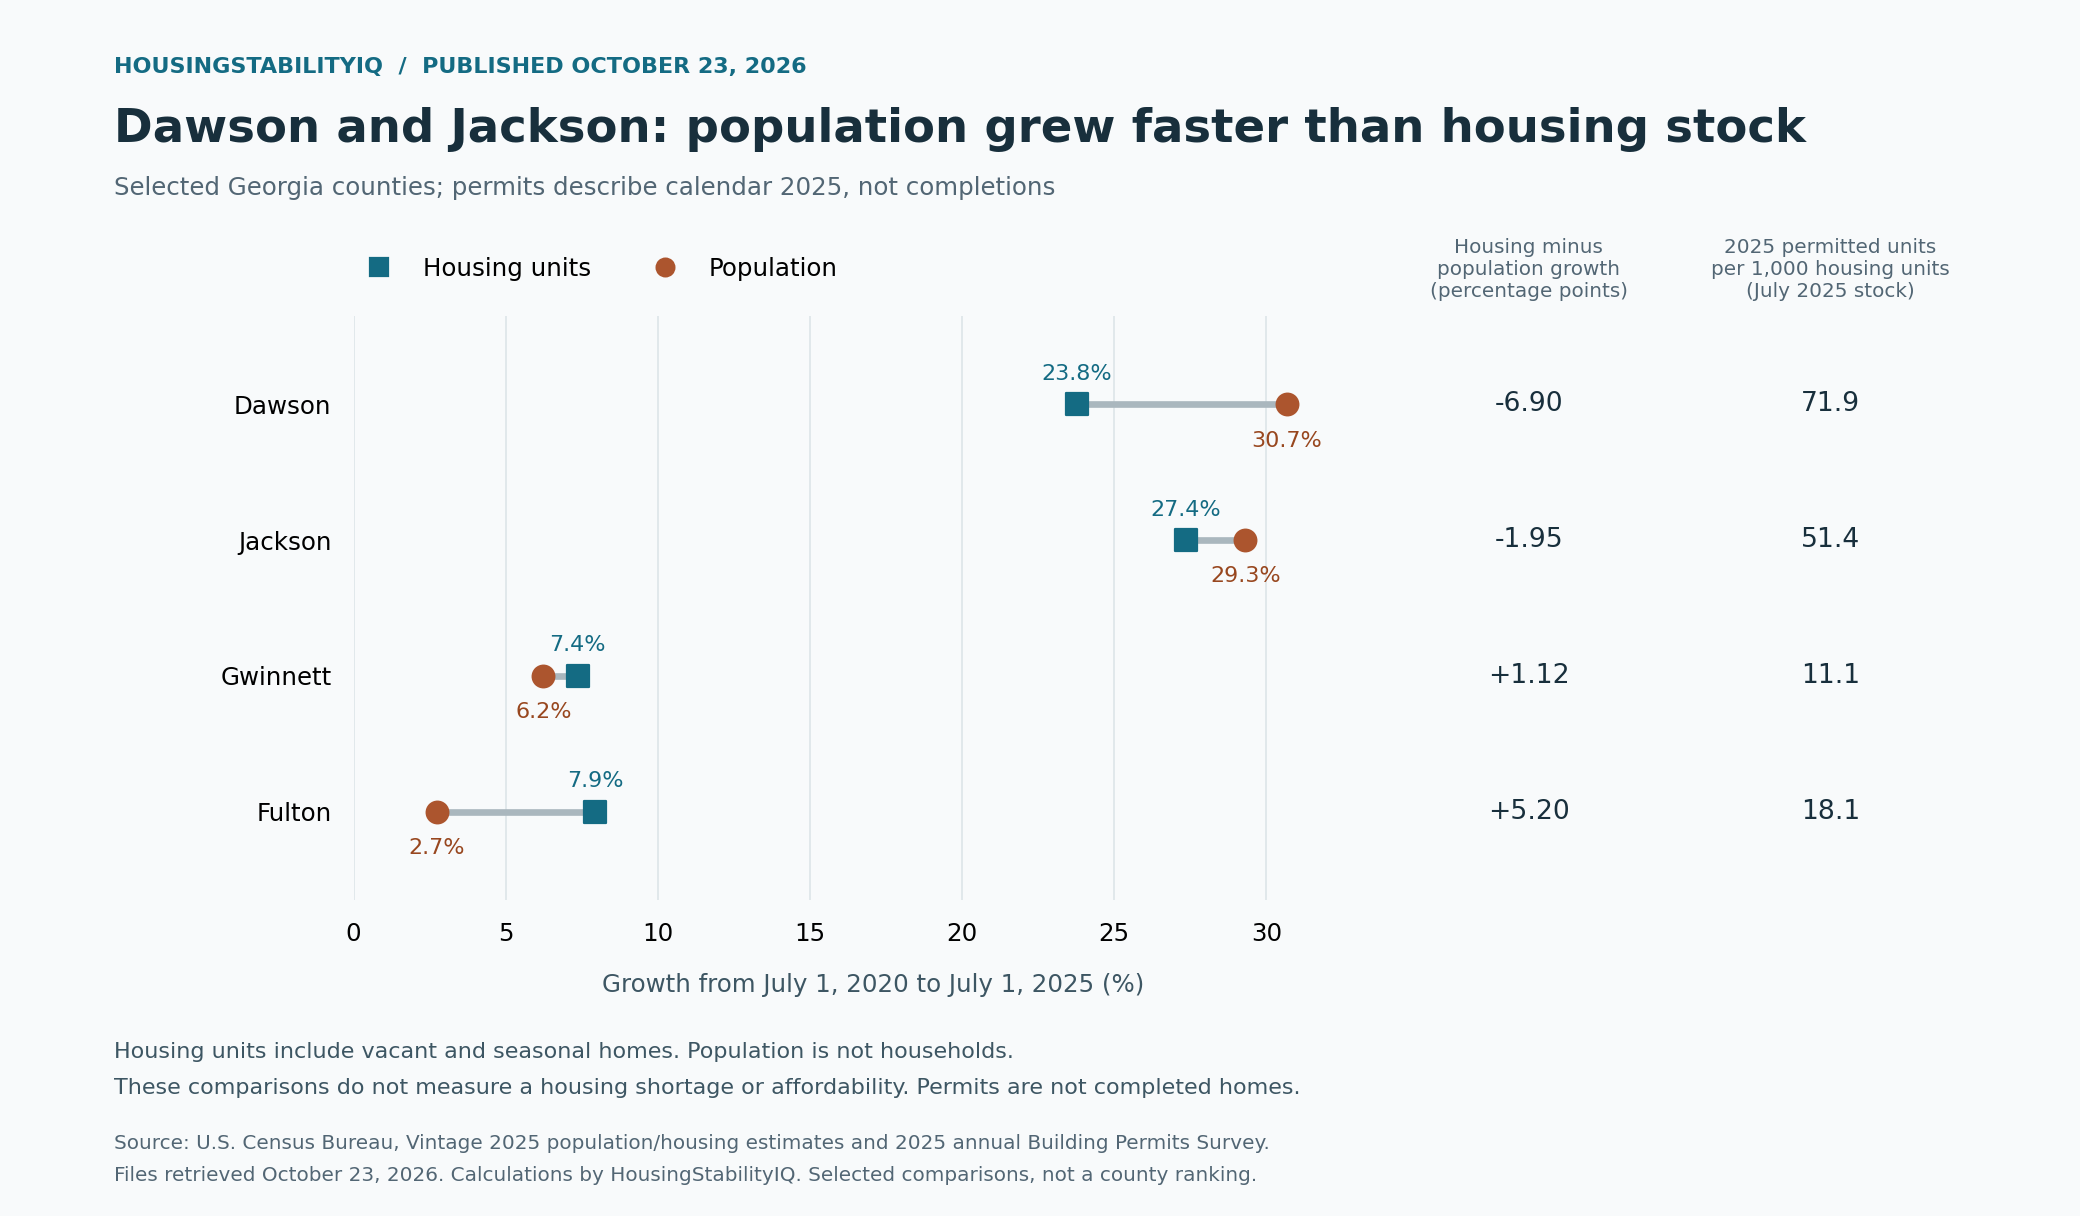
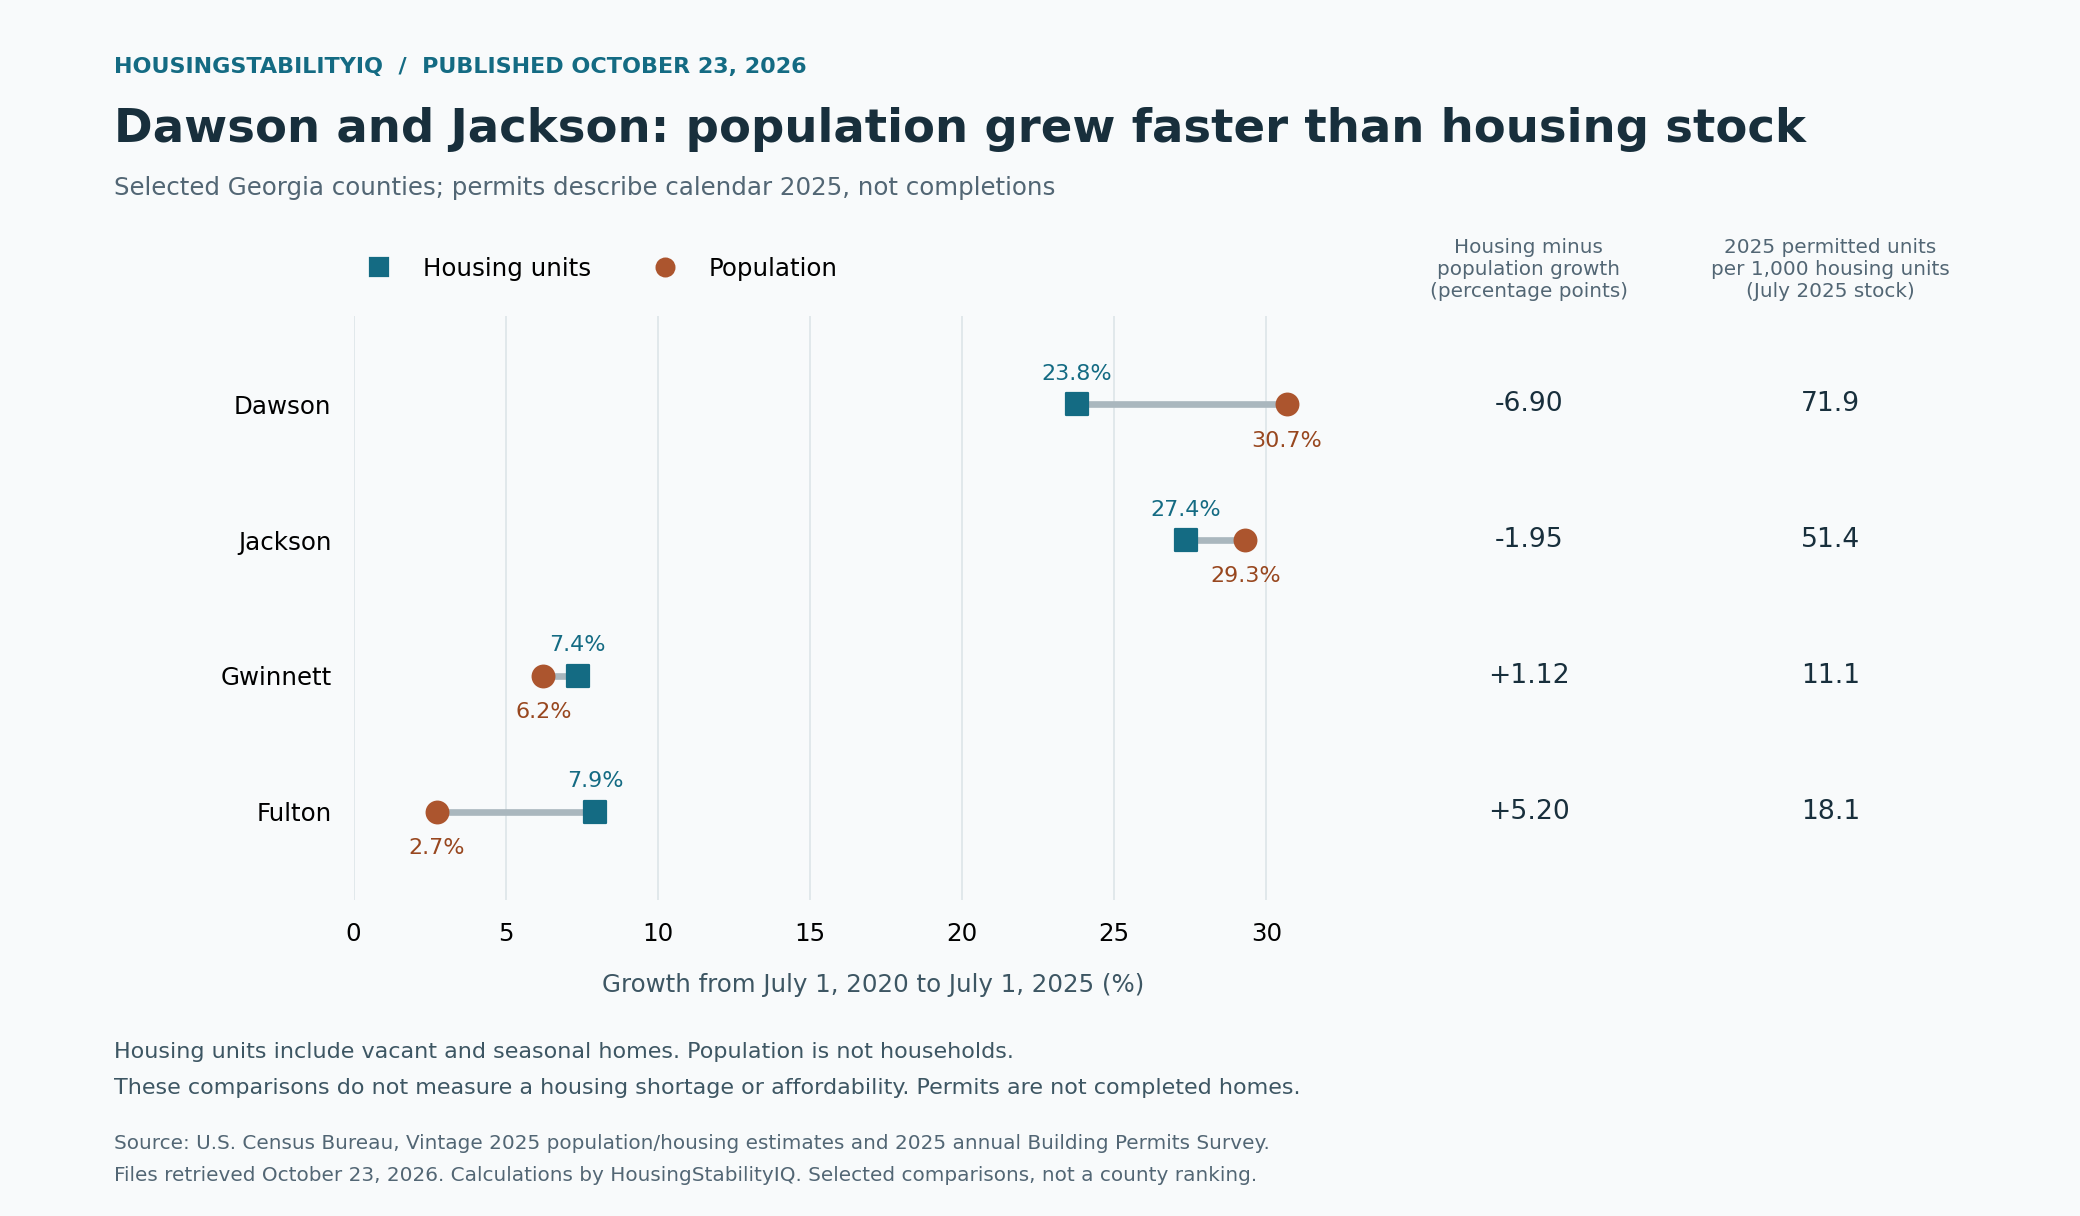
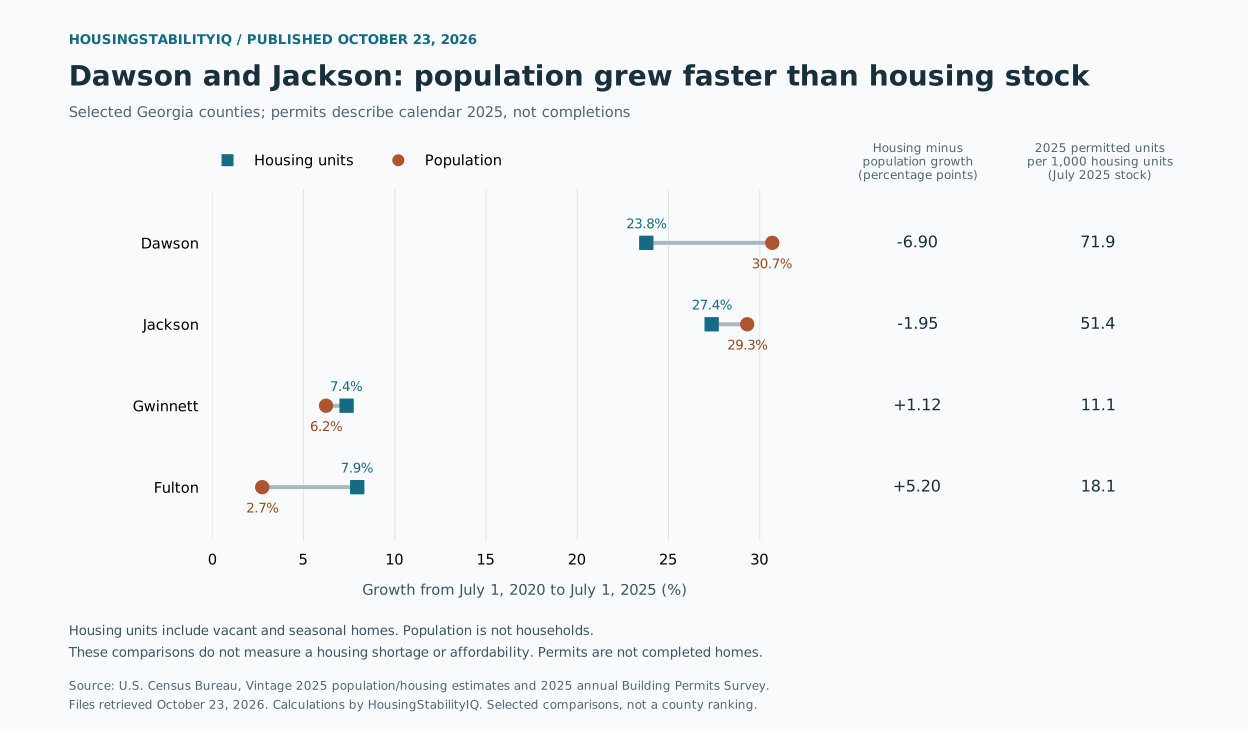
In Dawson County, population increased 30.68% between July 2020 and July 2025, while housing units increased 23.78%. Housing growth was therefore 6.90 percentage points lower. Jackson County also had very rapid growth in both measures: housing units increased 27.36% and population increased 29.31%.
Dawson nevertheless had the highest 2025 permit rate among the 156 Georgia counties with an observed value in the annual Census file: 71.86 permitted housing units per 1,000 July 2025 housing units. That rate comes from 1,069 permitted units divided by an estimated stock of 14,876. Jackson ranked second among those observed counties at 51.37 per 1,000.
These are different periods and different measures. A high annual permit rate does not establish that a five-year growth difference has closed or will close. Fulton and Gwinnett supply useful comparisons: both had housing-unit growth above population growth, with substantially lower 2025 permit rates than Dawson and Jackson.
| County | FIPS | Housing growth | Population growth | Difference (pp) | 2025 permits / 1,000 homes |
|---|---|---|---|---|---|
| Dawson County | 13085 | 23.78% | 30.68% | -6.90 | 71.86 |
| Jackson County | 13157 | 27.36% | 29.31% | -1.95 | 51.37 |
| Gwinnett County | 13135 | 7.36% | 6.24% | +1.12 | 11.08 |
| Fulton County | 13121 | 7.95% | 2.74% | +5.20 | 18.07 |
The selected counties are Dawson, Jackson, Gwinnett, and Fulton. No Atlanta metropolitan-area aggregate is calculated. All 159 Georgia counties are included in the stock/population study. Permit data are unavailable for Glascock, Taliaferro, and Wilcox; the permit-rate ranking is explicitly limited to the other 156.
North Carolina: Wake and Durham differ from Johnston and Lee
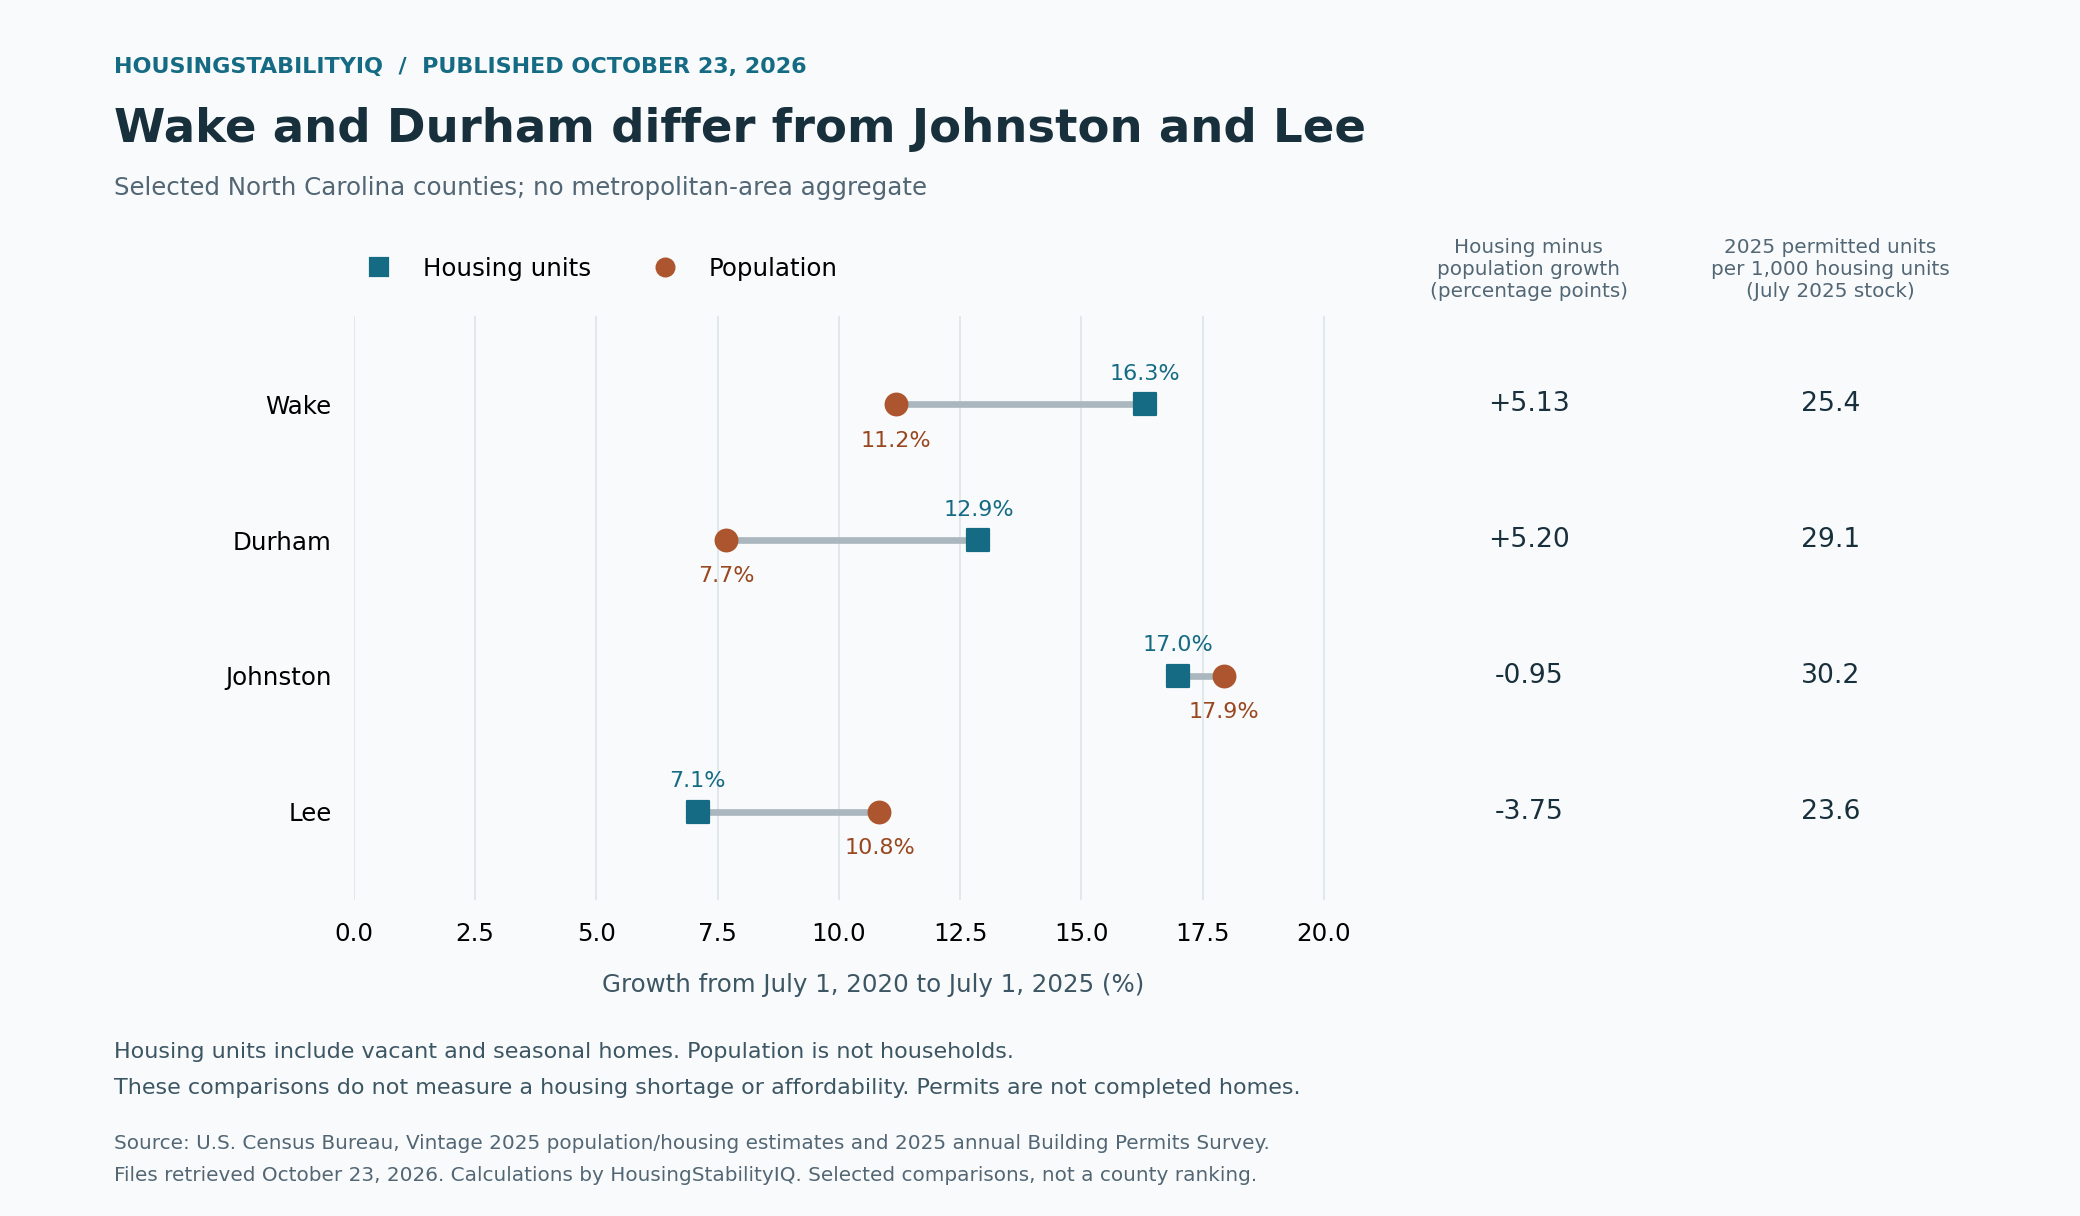
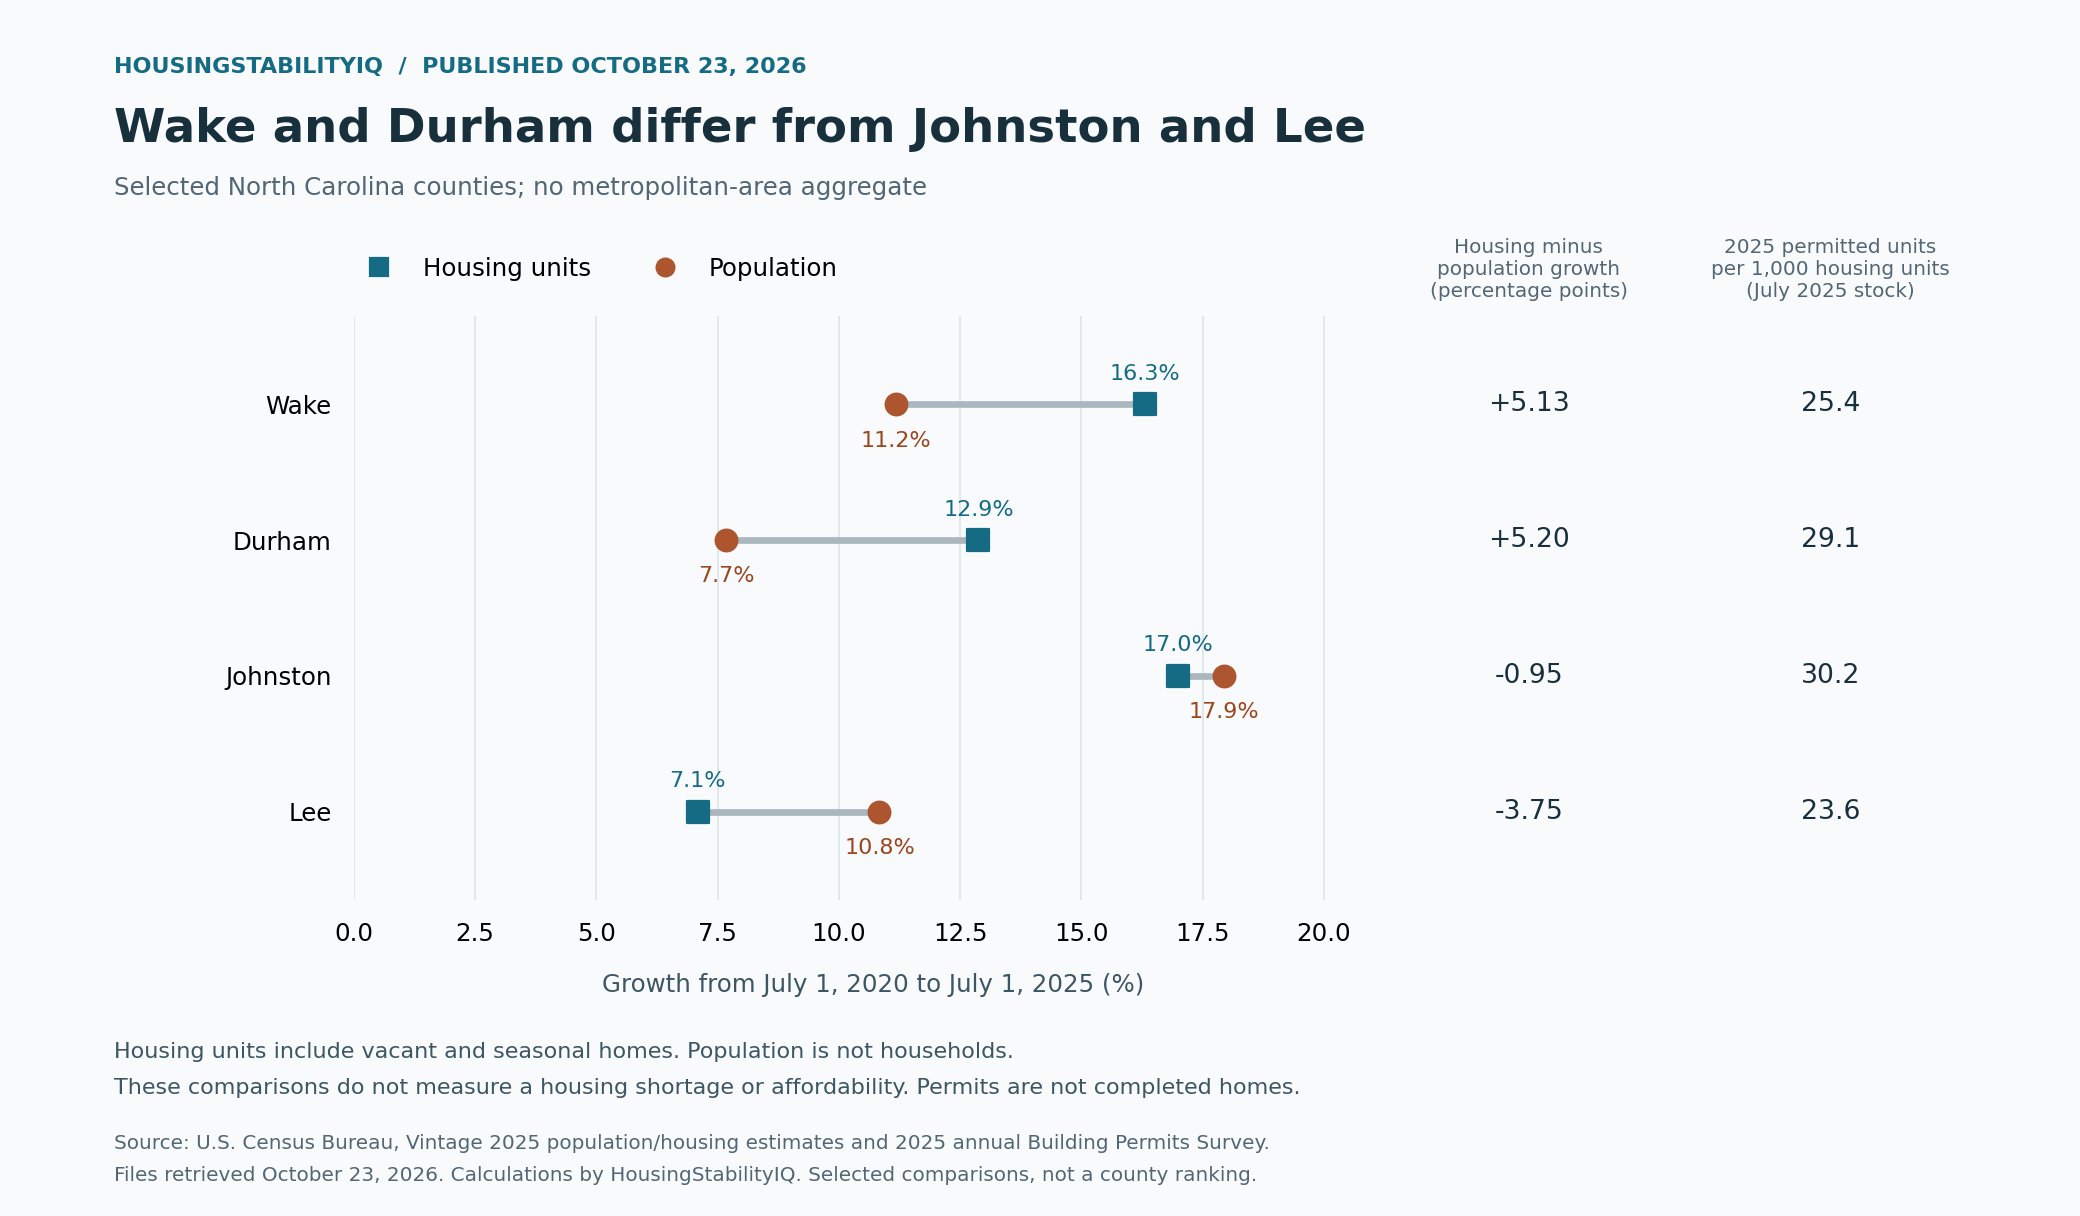
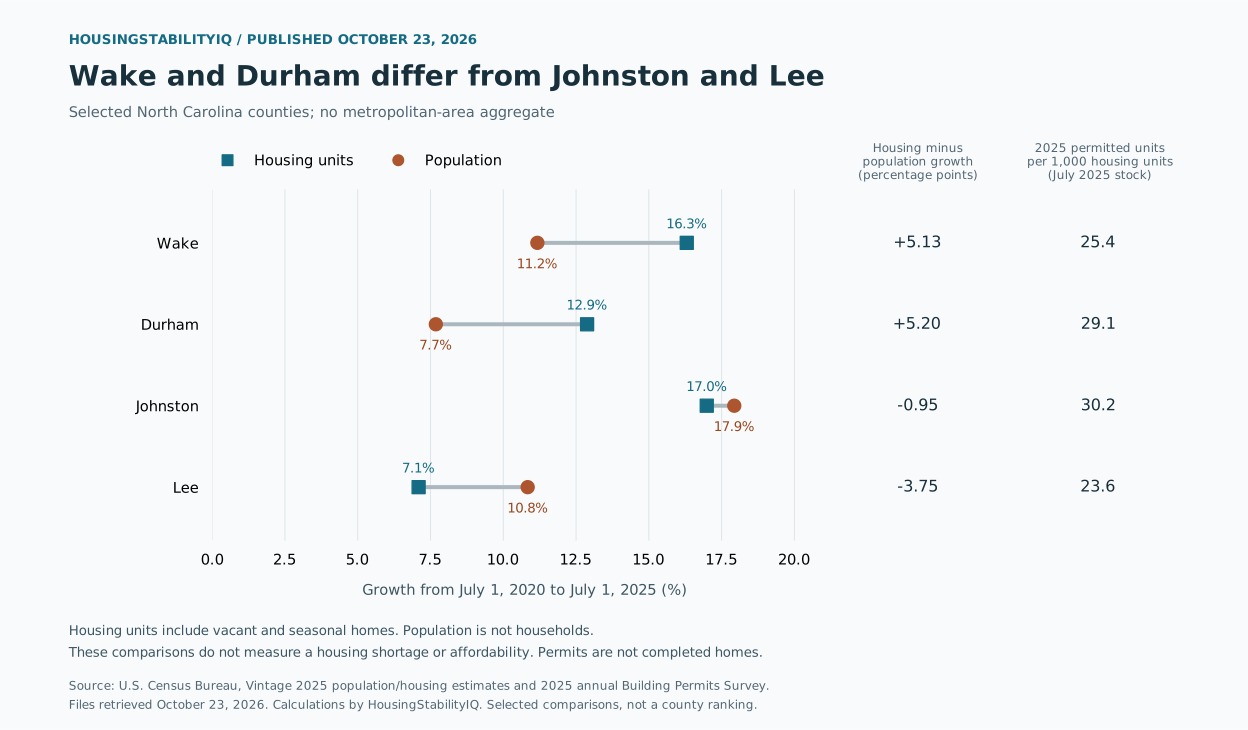
North Carolina’s housing-unit count increased 9.27%, versus population growth of 7.16%. The difference was larger in Wake and Durham counties: housing growth exceeded population growth by 5.13 and 5.20 percentage points, respectively.
Johnston moved in the other direction. Its housing stock increased 16.99%, but population increased 17.93%, leaving housing growth 0.95 percentage points lower. In Lee County, housing growth of 7.09% was below population growth of 10.84%, a difference of −3.75 points.
This contrast is not simply a division between counties that built and counties that did not. Johnston recorded 30.20 permitted units per 1,000 housing units in calendar 2025, compared with Wake’s 25.42. Those permits are a separate annual context measure, not an explanation of the five-year difference.
| County | FIPS | Housing growth | Population growth | Difference (pp) | 2025 permits / 1,000 homes |
|---|---|---|---|---|---|
| Wake County | 37183 | 16.30% | 11.17% | +5.13 | 25.42 |
| Durham County | 37063 | 12.88% | 7.68% | +5.20 | 29.06 |
| Johnston County | 37101 | 16.99% | 17.93% | -0.95 | 30.20 |
| Lee County | 37105 | 7.09% | 10.84% | -3.75 | 23.64 |
The selected comparison comprises Wake, Durham, Johnston, and Lee counties; it is not a defined Triangle or metropolitan-area total. The complete analysis covers all 100 North Carolina counties, including the 25 where population grew faster than housing units.
What the comparison can—and cannot—tell readers
A positive housing-minus-population growth difference means the number of housing units per resident increased over the period. A negative difference means it decreased. Neither result establishes how much housing households need, whether units are available to rent or buy, whether housing is affordable, or why the two series changed.
Housing-unit estimates include occupied, vacant, and seasonal units. Population includes people living in group quarters and is not a household count. Changes in household size and occupancy matter. These estimates also do not isolate the effect of zoning, migration, disasters, interest rates, or any other proposed cause.
Building permits measure new privately owned residential units authorized in permit-issuing areas. They are not starts, completions, occupied homes, or total net stock additions. Calendar 2025 permits extend beyond the July 1, 2025 endpoint of the stock comparison. Census housing estimates themselves use earlier permit information, completion assumptions, manufactured-home information, and housing-loss estimates, so permits are not an independent causal test.
Data, coverage, and reproducibility
The analysis matches all 3,144 counties and county equivalents in the official population file for the 50 states and District of Columbia to the housing workbook. Puerto Rico and other territories are outside that universe. Florida, Georgia, and North Carolina have complete stock/population coverage of 67, 159, and 100 counties.
The permit file contains 3,029 rows, of which 3,024 match official counties and five describe unallocated territory or balance-of-state areas. The latter are excluded from county rates. Nationally, 120 counties have no source row; missing values remain unavailable. The 247 matched counties reporting zero permitted units retain zero. Florida and North Carolina have complete permit coverage; Georgia has 156 of 159 counties.
For each county, growth is 100 × (2025 count / 2020 count − 1). The growth difference subtracts population growth from housing growth, in percentage points. Permit intensity is 1,000 × 2025 permitted units / July 2025 housing units. State permit rates use only counties with both numerator and denominator observed.
All three source files were retrieved October 23, 2026. The housing file is the May 2026 Vintage 2025 release, the population file was last modified March 26, 2026, and final annual 2025 permits were released May 14, 2026. These are historical comparisons using the specified releases, not October 2026 market readings. The archived files, hashes, exact retrieval timestamps, source-row references, full county data, and preparation scripts are available in the reproducibility download below.
Underlying sources: Census housing estimates, housing methodology, population methodology, annual county permits, and BPS methodology. Analysis and charts: HousingStabilityIQ.
Data and reproducibility downloads
Complete official county coverage, source snapshots and reproducible Python scripts. The archive contains source hashes and detailed missingness notes. The charts above also provide PNG and SVG downloads.
- All 3,144 counties (CSV)
- The 14 chart counties (CSV)
- State summaries (CSV)
- National summary (CSV)
- Missing county permit observations (CSV)
- Original source URLs, retrieval timestamps and SHA-256 hashes (JSON)
- Source files, analysis, charts and reproduction instructions (ZIP)
Suggested citation
HousingStabilityIQ. “Housing Stock and Population Growth, 2020–2025: Florida, Georgia and North Carolina.” October 23, 2026. Underlying data: U.S. Census Bureau Vintage 2025 population and housing estimates and annual 2025 Building Permits Survey. Cite this page for the analysis and Census for the original data.
Explore state context: Florida · Georgia · North Carolina. These profiles retain their separately dated score and conditions editions.
Questions or corrections: contact@housingstabilityiq.com.