Las Vegas metro · ACS one-year research
Required association fees are widespread in the Las Vegas metro
Las Vegas-Henderson-North Las Vegas, NV Metro Area · 2025 ACS one-year estimates with 2024 comparisons
By HousingStabilityIQ · Published · 2025 source files retrieved October 29, 2026
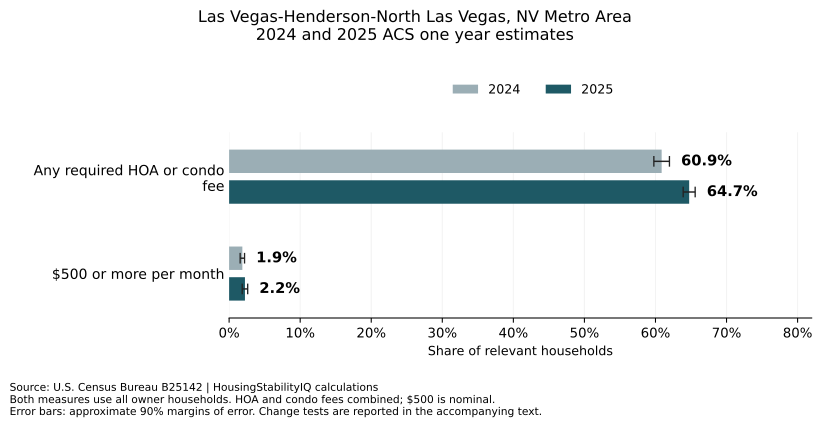
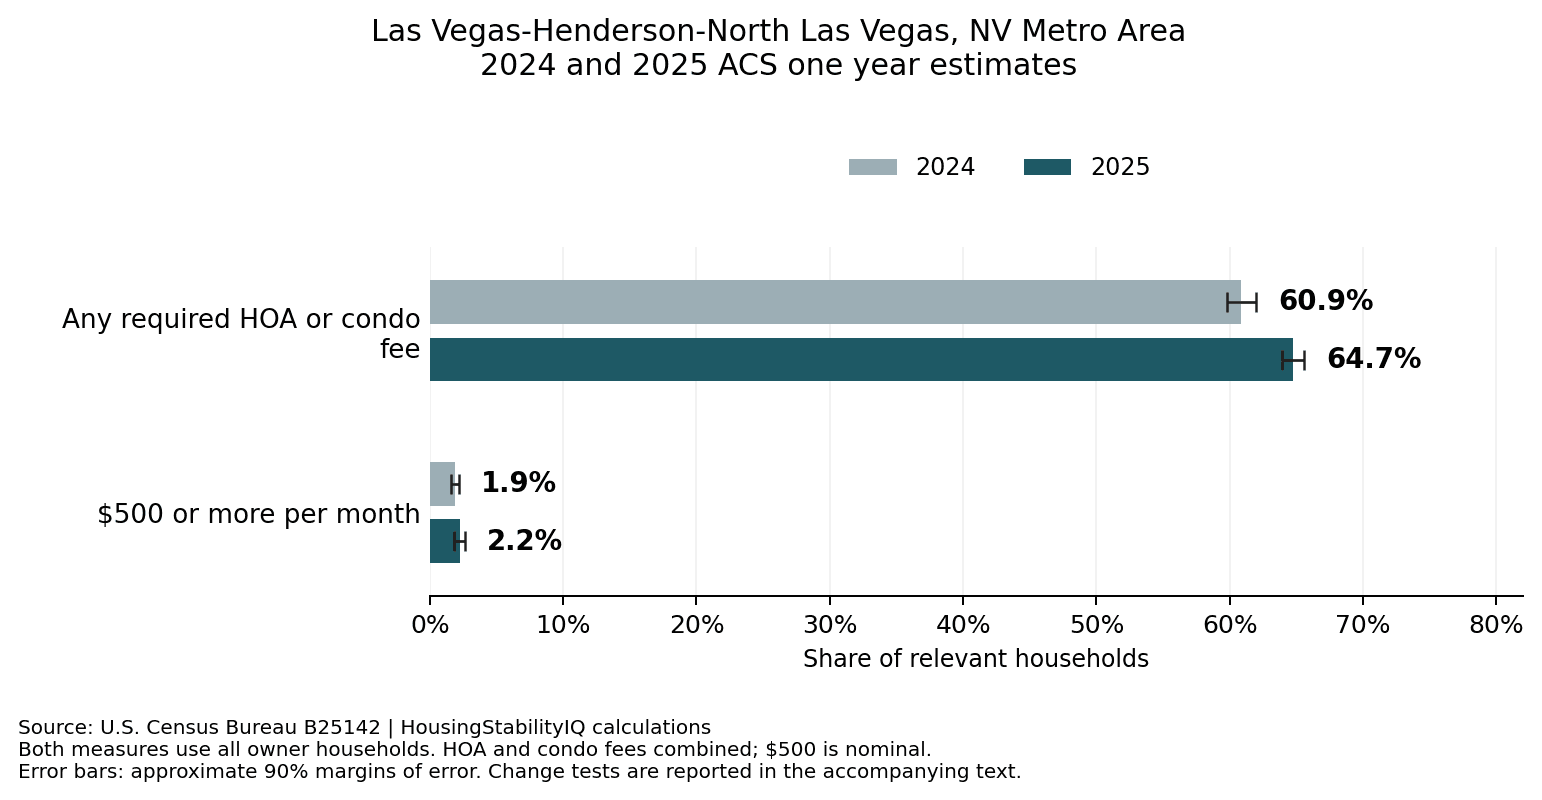
An estimated 343,048 owner households in the Las Vegas-Henderson-North Las Vegas, NV metropolitan area reported a required homeowners association and/or condominium fee in 2025, representing 64.7% of all owners.
An estimated 11,807 owner households reported regular fees of at least $500 per month, or 2.2% of all owners. Both percentages use 529,871 owner households. The high-fee group is included in the any-fee group.
The year over year comparison
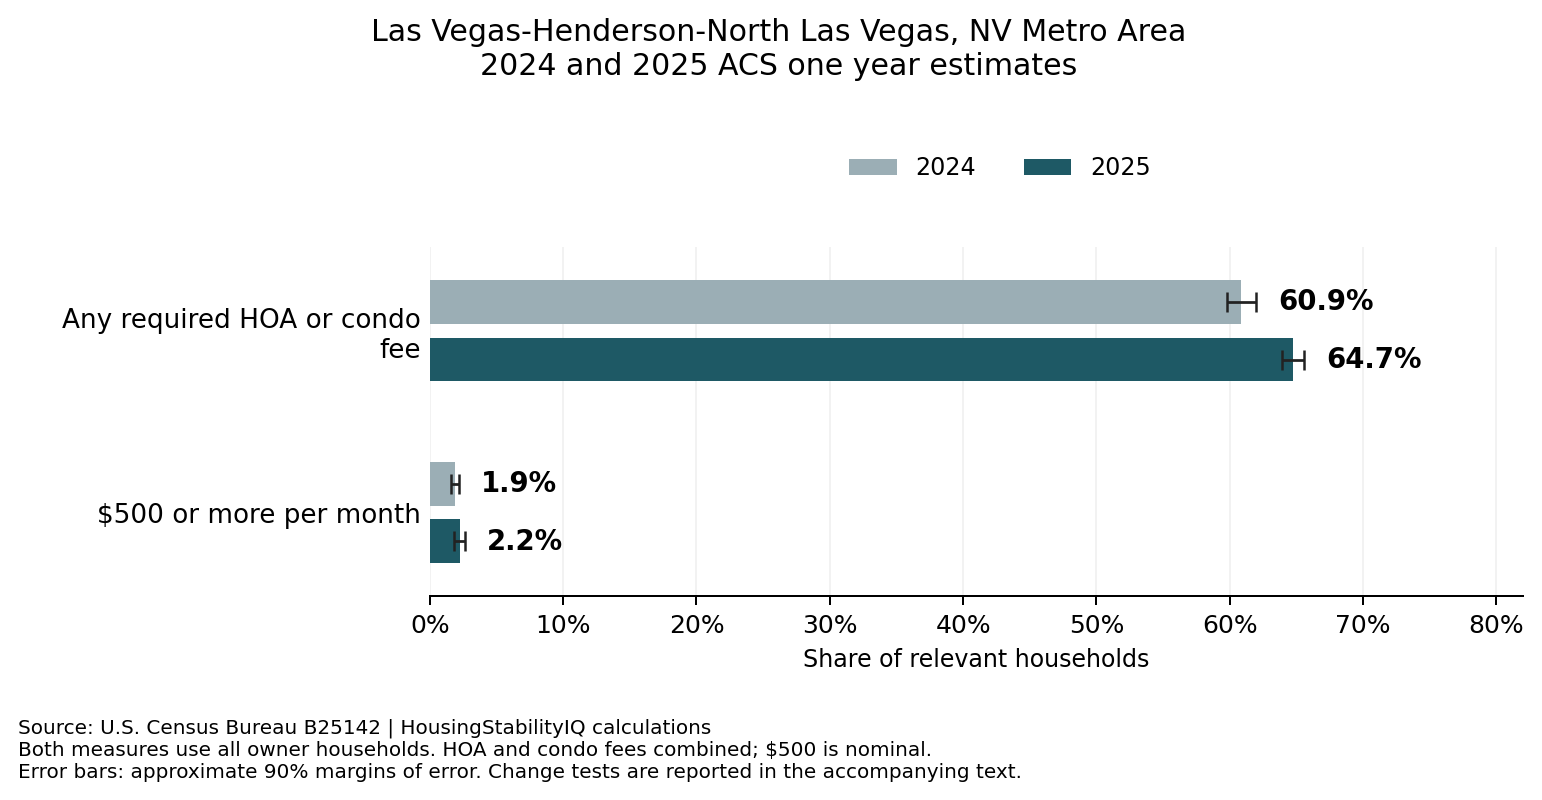
Any required HOA or condo fee: 60.9% in 2024 to 64.7% in 2025, a change of +3.87 percentage points (approximate 90% margin of error ±1.38 points). The change is distinguishable from zero in the unadjusted comparison.
$500 or more per month: 1.9% in 2024 to 2.2% in 2025, a change of +0.37 percentage points (approximate 90% margin of error ±0.49 points). The change is not distinguishable from zero in the unadjusted comparison.
Any required HOA or condo fee: the change remains distinguishable after both Holm and Bonferroni correction across all 12 comparisons at a familywise alpha of 0.10. The other rate change does not. This does not establish a durable trend or its cause.
Las Vegas estimates and margins of error
| Measure | Year | Households ± MOE | Denominator ± MOE | Share ± MOE |
|---|---|---|---|---|
| Any required HOA or condo fee | 2024 | 313,403 ± 7,565 | 514,880 ± 8,272 | 60.87% ± 1.10 pp |
| $500 or more per month | 2024 | 9,591 ± 1,597 | 514,880 ± 8,272 | 1.86% ± 0.31 pp |
| Any required HOA or condo fee | 2025 | 343,048 ± 8,178 | 529,871 ± 10,575 | 64.74% ± 0.84 pp |
| $500 or more per month | 2025 | 11,807 ± 2,061 | 529,871 ± 10,575 | 2.23% ± 0.39 pp |
Counts and their MOEs are rounded independently to whole households. Share estimates and MOEs are displayed to two decimal places. Tests use unrounded values.
What is measured
Required HOA and condominium fees are combined. B25142: any-fee numerator E002; $500-or-more numerator E012 + E013 + E014 + E015. Both use E001, all owner-occupied housing units. The high-fee group is part of the any-fee group, not an additional category.
Reported fees are regular monthly amounts, including amounts paid by someone outside the household or still unpaid, not audited cash collections. These data do not separate HOA from condo fees, identify associations, measure special assessments or establish fee-driven displacement.
The $500 threshold is nominal in each year and is not inflation-adjusted. A change in the share above it is not a measure of inflation-adjusted fee growth.
Local reporting limits
Fee prevalence and fee size answer different questions. The Las Vegas metro has a substantial share of owners reporting required association or condominium fees, while the share reporting at least $500 per month is much smaller. The distinction avoids treating all households reporting fees as facing the same expense.
Reading these comparisons
A difference that is not distinguishable from zero is inconclusive, not evidence that the true rate was unchanged. Individual approximate 90% tests are shown alongside a 12-test Holm and Bonferroni sensitivity analysis. See the methods below for formulas, 2025 collection and population-control caveats, and sources. Metro results are not city or neighborhood estimates; geographies can overlap.
The 2024 ACS expanded the required-fee question to include HOA fees, which also entered selected owner costs. Pre-2024 fee and related owner-cost comparisons have a measurement break; this refresh compares 2025 only with 2024.
Source: U.S. Census Bureau, 2024 and 2025 ACS one year detailed table B25142. The data table reports counts and denominators as estimates, with their approximate margins of error; counts are not administrative totals.
Methods and comparability
How uncertainty is estimated
The ACS publishes margins of error at the 90% confidence level. For sums and differences of component counts, this analysis combines component MOEs by root-sum-of-squares. Percentage MOEs use the Census subset-proportion approximation: the square root of the numerator MOE squared minus the squared share times the denominator MOE squared, divided by the denominator and multiplied by 100. If the expression under the square root is negative, the corresponding additive ratio approximation is used.
The year over year difference is the 2025 percentage minus the 2024 percentage. Its approximate 90% MOE is the square root of the sum of the two percentage MOEs squared. The unadjusted comparison is called distinguishable when the absolute difference exceeds that MOE. This treats the annual estimates as independent; it does not incorporate a covariance term. All tests use unrounded estimates, not the displayed one-decimal chart values.
These two Las Vegas measures were part of a fixed family of 12 preselected comparisons across six metropolitan areas. Both Las Vegas measures are presented here regardless of the outcome. Approximate two-sided p-values were evaluated using Holm and Bonferroni corrections across all 12 tests at familywise alpha 0.10. The required-fee incidence increase passes both corrections; the $500-or-more rate change passes neither. These adjustments address false positives, not nonsampling error or the 2025 method changes.
The any-fee change has an approximate two-sided p-value of 0.000004154 and Holm and Bonferroni adjusted p-values of 0.000049847. The $500-or-more change has an unadjusted p-value of 0.2241. A result that is not distinguishable from zero is inconclusive, not proof of no change.
Changes affecting the 2025 ACS
The 2025 lapse in federal appropriations suspended ACS collection for six weeks and disrupted the August through November panels. Mailings and in-person follow-up were canceled, delayed or shortened. Census reports effects on the final annual sample size and noticeable effects on response rates and margins of error. The comparisons should be read with these collection limitations in mind. Source: Census user note 2026-04.
The 2025 ACS uses Vintage 2025 population controls. These no longer start from the blended base used in recent years; they use the 2020 Census Modified Age and Race Census file, with age-distribution corrections and boundary updates. Census also describes migration-methodology updates. These are changes to survey controls, not evidence that the selected housing measures changed definition. Source: Census user note 2026-05.
For 2025 ACS one year tabulations, Census discontinued household record swapping and removed selected legacy disclosure-focused release rules. The core population thresholds and legacy data-quality rules remain. These processing changes are additional context for annual comparisons; they do not by themselves establish a break in the definitions of the selected housing tables. Source: Census user note 2026-06.
Geography and source precision
The geography is the Las Vegas-Henderson-North Las Vegas, NV Metro Area (CBSA 29820; GEO_ID 310M700US29820), using all owner-occupied housing units in each year. Both years use the July 2023 OMB metropolitan-area delineations. These are metropolitan estimates, not estimates for the City of Las Vegas or its neighborhoods.
This ACS one-year research is separate from HousingStabilityIQ’s published five-year score. It does not update that score, rank markets nationally, track the same households, or establish the cause of a change.
Source data are the U.S. Census Bureau ACS one year detailed tables for 2024 and 2025. The evidence package retains unrounded selected estimates, component definitions, source files and checksums. Displayed counts are rounded to whole households and displayed MOEs are rounded independently. Percentage-point changes and their MOEs are rounded to two decimal places.
The 2024 baseline was frozen on October 24, 2026; 2025 table files were retrieved October 29, 2026. The download preserves the selected records and the original full-file source checksums. The Las Vegas reproduction script checks the four yearly estimates, two annual changes and Bonferroni results. A Bonferroni rejection also guarantees a Holm rejection for the same test family; exact Holm adjusted p-values were separately verified against the full 12-comparison family before publication.
Primary sources
- 2024 ACS B25142 variable definitions
- 2025 ACS B25142 variable definitions
- 2025 subject definitions
- Comparing 2025 data
- 2024 fee question expansion
- 2025 ACS collection disruption
- 2025 ACS population controls
- 2025 ACS disclosure avoidance changes
- Statistical testing
- 2025 ACS metropolitan-area boundaries
- 2024 ACS metropolitan-area boundaries
Las Vegas data and chart downloads
The evidence ZIP contains only Las Vegas selected source records, estimates, source provenance, methods, a Python reproduction script and this chart. It preserves the frozen 2024 inputs and the October 29, 2026 retrieval of the 2025 inputs.