Maine heating fuels · 2025 research
Maine renters report electric heat more often than homeowners
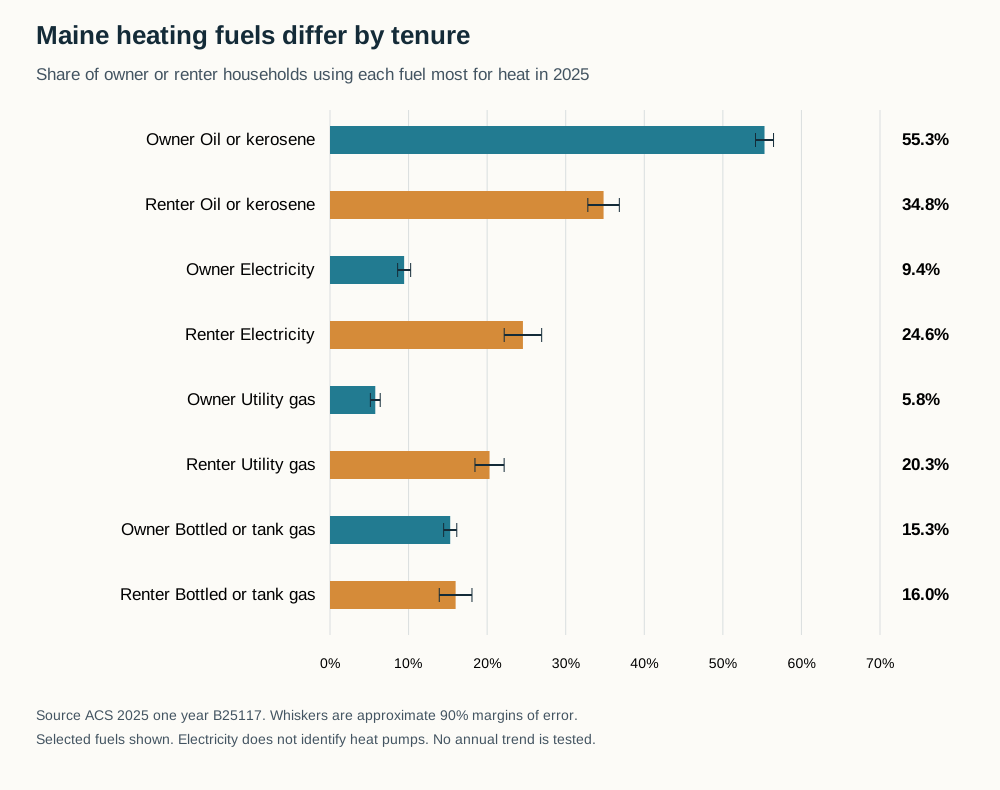
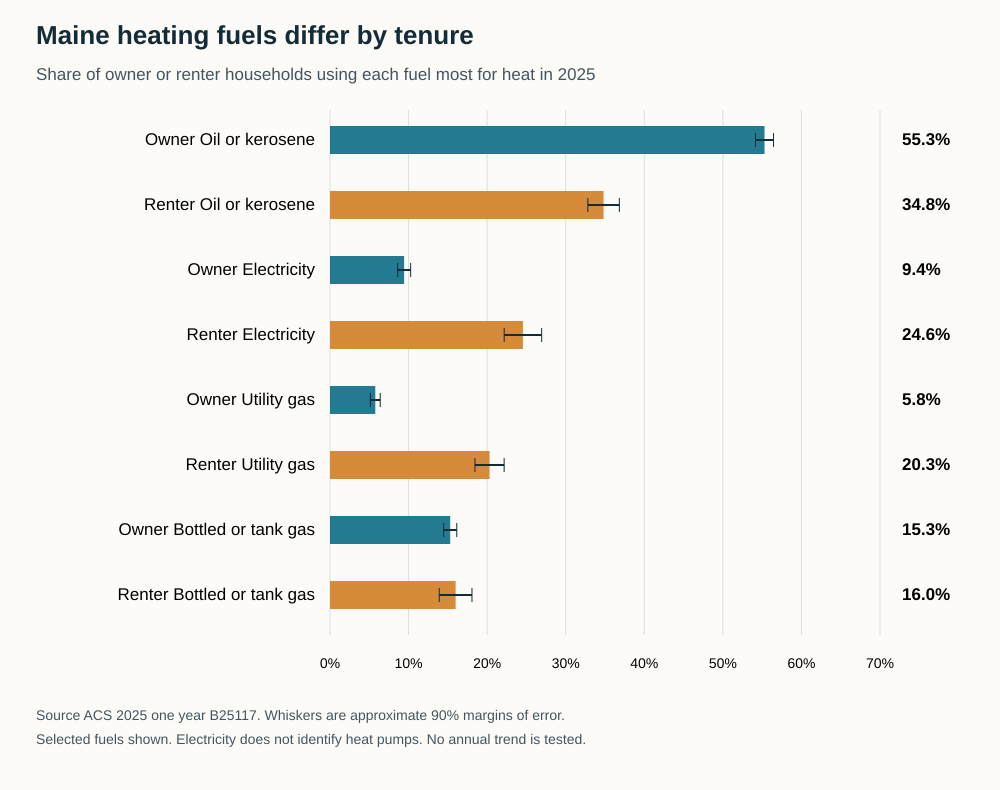
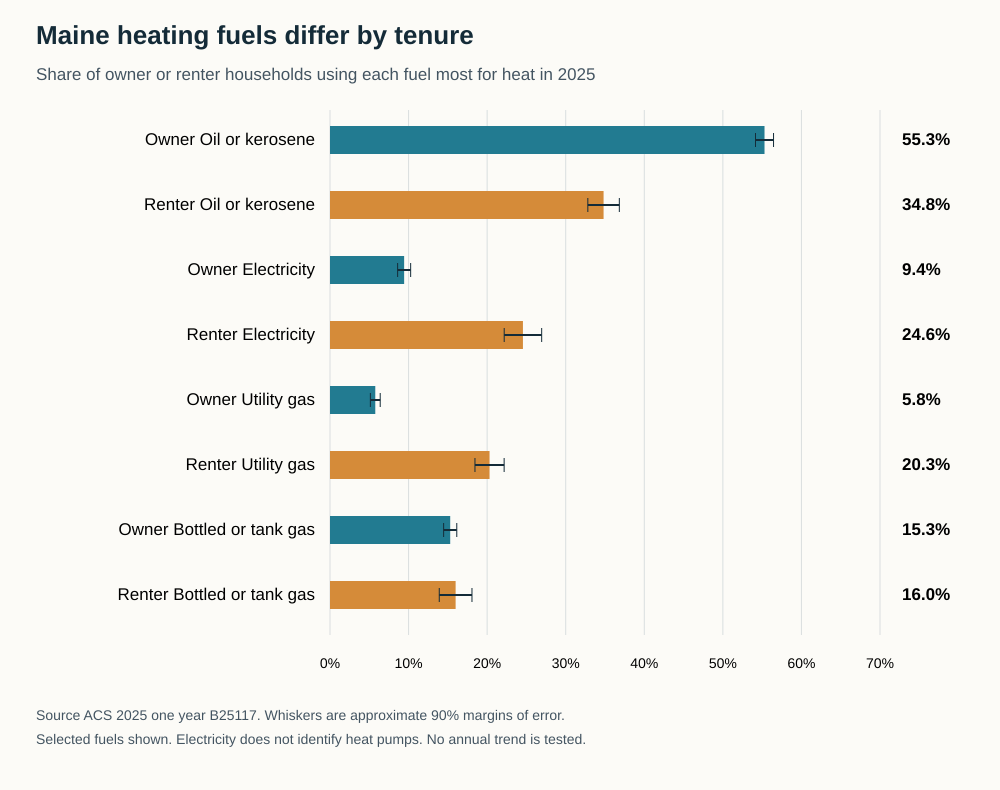
Maine’s owner and renter households reported nearly the same number of homes heated primarily with electricity in 2025. But electricity played a much larger role in the rental market: 24.6% of renter households named it as their main heating fuel, compared with 9.4% of owner households.
The apparent contradiction is a denominator problem. Maine had an estimated 459,164 owner households and 161,595 renter households. The 43,327 owner households reporting electricity therefore represented a much smaller share of their group than the 39,681 renter households reporting the same fuel. HousingStabilityIQ calculated those shares from the Census Bureau’s 2025 American Community Survey table on tenure and heating fuel.
The figures describe fuel, not equipment. They do not show that renters were more likely to have heat pumps, that their systems were more efficient, or that their heating bills were lower. The ACS asks which fuel is used most to heat a residence; it does not identify the equipment behind an electricity response. That distinction matters in a state where heating policy often centers on a transition away from oil. Census questionnaire
One statewide figure covers different housing markets
Oil and kerosene remained the most commonly reported heating-fuel category for both groups. An estimated 253,925 owner households used that category most for heating, or 55.3% of owners. Among renters, the estimate was 56,266 households, or 34.8%.
Those estimates yield a 20.5-percentage-point difference. Approximate 90% margins of error are 1.2 points for the owner share and 2.0 points for the renter share. The electric-heating shares have corresponding margins of 0.8 and 2.4 points. Both tenure contrasts remain statistically distinguishable under the conservative multiple-comparison adjustment used for this analysis.
Utility gas also played different roles: 20.3% of renter households reported it, compared with 5.8% of owners. Bottled or tank gas, a category including propane, was closer: 16.0% of renters and 15.3% of owners. The data do not establish a tenure difference for that category.
| Group / category | Estimated units or households | Denominator | Share ± 90% MOE |
|---|---|---|---|
| Owner occupied Utility gas | 26,464 | 459,164 | 5.76% ± 0.63 pp |
| Renter occupied Utility gas | 32,814 | 161,595 | 20.31% ± 1.86 pp |
| Owner occupied Bottled or tank gas | 70,249 | 459,164 | 15.30% ± 0.84 pp |
| Renter occupied Bottled or tank gas | 25,835 | 161,595 | 15.99% ± 2.08 pp |
| Owner occupied Electricity | 43,327 | 459,164 | 9.44% ± 0.83 pp |
| Renter occupied Electricity | 39,681 | 161,595 | 24.56% ± 2.38 pp |
| Owner occupied Fuel oil or kerosene | 253,925 | 459,164 | 55.30% ± 1.15 pp |
| Renter occupied Fuel oil or kerosene | 56,266 | 161,595 | 34.82% ± 2.00 pp |
| Owner occupied Coal or coke | 840 | 459,164 | 0.18% ± 0.13 pp |
| Renter occupied Coal or coke | 17 | 161,595 | 0.01% ± 0.02 pp |
| Owner occupied Wood | 53,210 | 459,164 | 11.59% ± 0.78 pp |
| Renter occupied Wood | 3,150 | 161,595 | 1.95% ± 0.51 pp |
| Owner occupied Solar energy | 1,678 | 459,164 | 0.37% ± 0.13 pp |
| Renter occupied Solar energy | 166 | 161,595 | 0.10% ± 0.12 pp |
| Owner occupied Other fuel | 8,955 | 459,164 | 1.95% ± 0.32 pp |
| Renter occupied Other fuel | 1,863 | 161,595 | 1.15% ± 0.53 pp |
| Owner occupied No fuel used | 516 | 459,164 | 0.11% ± 0.07 pp |
| Renter occupied No fuel used | 1,803 | 161,595 | 1.12% ± 0.50 pp |
Scroll the table horizontally on smaller screens. Full-precision values and definitions are in the chart-data CSV and evidence ZIP.
The pattern is not evidence that tenure itself determines fuel choice. This comparison does not hold building type, age, location, income or other characteristics constant. It also does not identify who selects the heating system or pays a fuel bill when heat is included in rent.
A fuel count is not an equipment inventory
Maine’s fuel mix has been examined before. Efficiency Maine’s 2024 residential baseline study includes tenure and primary-fuel tables drawn from the 2022 ACS. The new contribution here is a reproducible 2025 snapshot with separate tenure denominators and uncertainty—not the discovery that owners and renters occupy different kinds of housing.
Nor is this an annual-change story. A home that uses both electricity and oil is classified by the fuel used most. The table cannot count every home with an oil backup system, every installed heat pump, or every household using more than one source. An electricity response alone cannot resolve those questions.
For housing and energy reporting, the useful result is narrower: one statewide fuel percentage is not a substitute for looking separately at owner and renter households. In this snapshot, a similar number of electric-heated homes sits inside two very different-sized groups. Reporting just the counts misses that difference; reporting just the shares misses the scale of each group.
How the figures were checked
The analysis uses occupied housing units—equivalently, households—not people, vacant homes or installations. Source estimates, margins of error, table definitions and raw-file hashes are retained with the calculations. Heating-fuel responses were allocated, or statistically filled in, for 4.4% of Maine’s occupied housing units; that is a data-quality measure, not a measurement of incorrect responses.
The Census Bureau reports that a six-week interruption in 2025 data collection affected sample size, response rates and margins of error. It also changed some disclosure-avoidance and release procedures. These are reasons to retain the uncertainty and avoid an unsupported annual narrative, not reasons to treat missing values as zero. Collection note, release-rules note
Methods and interpretation limits
These are 2025 ACS one-year household cross-sections, not annual trends or national rankings. The collection interruption and changed disclosure/release procedures are disclosed in the archived methodology. Derived 90% margins are approximate and do not capture all nonsampling error.
The complete 44-comparison family is retained. Maine electricity, oil and utility-gas tenure contrasts pass the conservative adjustment; neither New Mexico facilities rate contrast passes. Individual chart intervals are not simultaneous intervals.
This research remains separate from the site’s five-year structural housing score and does not modify the score, calculator or database.
Fuel used most is not equipment type or every fuel used. Counts and percentages use separate owner and renter denominators; no heat-pump, bill, efficiency or causal-tenure inference is supported.
Read the full archived methodology. The evidence ZIP preserves frozen source files, source provenance and reproduction scripts.
Sources and context
Data and chart downloads
The evidence download is shared with the related studies that use the same source files. Keep the original folder layout when extracting it. Source and sensitivity records retained for reproducibility do not constitute additional published stories.