Memphis vacancy · 2025 research
Memphis-area vacancy includes repair work, not just abandonment
Census categories separate homes needing attention, homes already being worked on and homes offered for rent.
An empty housing unit is not necessarily an abandoned one—or a home a renter could move into. New Census estimates for the Memphis metropolitan area put numbers behind that distinction.
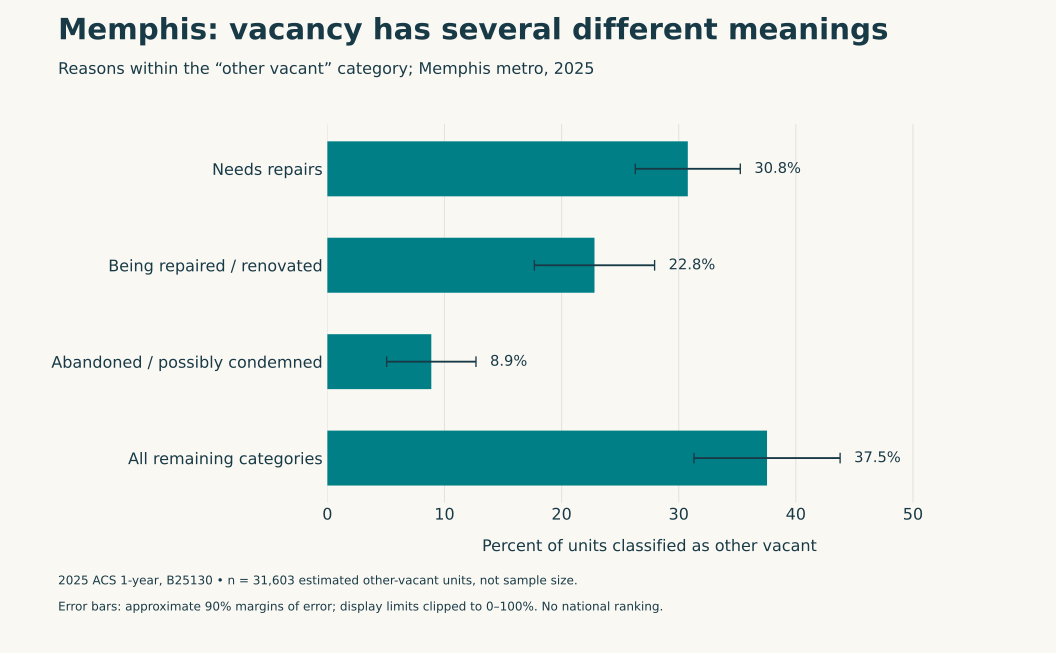
Within the category called “other vacant,” an estimated 9,726 housing units needed repairs in 2025, while 7,208 were already being repaired or renovated. Together, those two categories accounted for 16,934 units, or 53.6% of the region’s 31,603 other-vacant units. Another 2,805 units, or 8.9%, were classified as abandoned or possibly condemned. Source: 2025 American Community Survey, table B25130.
The combined repair-related percentage is an estimate, not a statistically certain majority: its approximate 90% margin of error is ±5.1 percentage points. More importantly, none of these categories is a building inspection or a promise that a home can be returned to use at a particular cost.
| Group / category | Estimated units or households | Denominator | Share ± 90% MOE |
|---|---|---|---|
| Needs repairs | 9,726 | 31,603 | 30.78% ± 4.48 pp |
| Being repaired / renovated | 7,208 | 31,603 | 22.81% ± 5.13 pp |
| Abandoned / possibly condemned | 2,805 | 31,603 | 8.88% ± 3.81 pp |
| All remaining other-vacancy categories | 11,864 | 31,603 | 37.54% ± 6.24 pp |
Scroll the table horizontally on smaller screens. Full-precision values and definitions are in the chart-data CSV and evidence ZIP.
Start with the right vacancy denominator
The metro had an estimated 65,429 vacant housing units in total. Of those, 25,243 were classified as for rent, 2,376 as seasonal, recreational or occasional-use housing, and 31,603 as other vacant. The remaining 6,207 were in the for-sale-only, sold-but-unoccupied, rented-but-unoccupied or migrant-worker categories. Source: ACS table B25004.
“Other vacant” is thus a subset of all vacancies. The 53.6% repair-related figure applies to that subset, not to every vacant home in the region. Likewise, the 38.6% classified as for rent is the share of vacant units offered for rent; it is not the rental vacancy rate, which uses a different denominator.
The distinction matters when an empty-home total is placed beside a discussion of housing need. Some vacant units are already on the rental market. Others are between occupants, reserved for seasonal use, undergoing work or held out of use for another reason. Adding those categories produces a useful inventory, but not a list of immediately available homes.
Repair needed and repair underway are different states
Census’s “needs repairs” definition includes work not yet underway, including renovation or cleaning. Its “currently being repaired/renovated” category includes active repair, refurbishment or cleaning. The categories do not distinguish a modest cleanup from a major reconstruction. Census subject definitions.
For the Memphis metro, the estimates divide repair-related vacancy into roughly 9,700 units awaiting such work and 7,200 where it was underway. That is more informative than treating all 16,934 as either an untouched backlog or an active development pipeline. It also prevents the abandoned/possibly-condemned category from becoming shorthand for everything outside the market.
The other-vacant total includes additional reasons, such as personal or family circumstances, legal proceedings and preparation for renting or selling. Those remaining categories together accounted for 11,864 units. The table does not identify addresses, ownership, intended future rents, financing gaps or the time needed to make a unit usable.
A familiar problem, a more current breakdown
Local officials have examined this issue before. Shelby County’s 2023 PRO Housing draft discussed repair needs and abandoned units using earlier county-level Census estimates. The new analysis is a current regional decomposition, not a claim that repair-related vacancy has just been discovered—and the older county counts should not be compared directly with the new metro counts as a trend. Shelby County’s earlier analysis.
The City of Memphis’s affordable-housing office separately describes support for rehabilitating vacant single-family and multifamily housing. That program purpose helps explain why distinguishing vacant-unit categories can be useful; the Census figures do not establish program eligibility or measure the program’s results. City of Memphis affordable-housing programs.
The next reporting questions are therefore specific: which units can be rehabilitated, what work is required, who controls them and what housing they would provide afterward? A regional survey cannot answer those address-level questions. It can keep the starting inventory from collapsing several different situations into the single word “abandoned.”
Scope and uncertainty
The estimates cover the Memphis, Tennessee–Mississippi–Arkansas metropolitan statistical area, not Memphis city or Shelby County alone. They describe the 2025 survey year, not conditions today. Counts have sampling error; the combined repair-related estimate has an approximate 90% margin of ±2,595 units. This selected example is not a national ranking, and its descriptive intervals are not corrected for the wider exploratory screen. The accompanying data preserve the source cells, denominators and margins needed to reproduce every reported figure.
Methods and interpretation limits
These are 2025 ACS one-year estimates for the named metropolitan areas, not their cities alone. Household estimates are not respondent counts. Sampling and nonsampling errors remain; derived 90% margins use approximate formulas without full covariance.
These examples were selected through exploration. Intervals are descriptive, not adjusted for the broader screen; no national ranking, trend, causal effect, equality or statistically certain majority is claimed. Keep each table’s stated denominator.
This research is separate from the site’s five-year structural housing score. It does not change the score, calculator or source database.
Repair categories can include cleaning. The combined estimate is 53.6% ±5.1 percentage points of other-vacant units, not a secure majority, immediate rental supply or rehabilitation eligibility.
Read the full archived methodology. The evidence ZIP preserves frozen source files, source provenance and reproduction scripts.
Sources and context
Data and chart downloads
The evidence download is shared with the related studies that use the same source files. Keep the original folder layout when extracting it. Source and sensitivity records retained for reproducibility do not constitute additional published stories.