Mississippi internet · 2025 research
Cellular only households are part of Mississippi broadband totals
About 91% of Mississippi households had a broadband internet subscription in 2025, according to the American Community Survey. That figure included an estimated 192,210 households whose only subscription type was a cellular data plan—16.1% of all households in the state.
The numbers are consistent, not contradictory. In the Census Bureau’s subscription table, “broadband of any type” includes cellular service. Reading the 91% figure as the share with cable, fiber or DSL at home would turn one measure into another. The separate estimate for those technologies was 68.6%. 2025 ACS internet-subscription table
The distinction matters when comparing household surveys with broadband infrastructure announcements. Mississippi received federal approval of its broadband expansion plan in February 2026. But the 2025 ACS figures are a household baseline, not a verdict on that later program’s performance or a count of addresses eligible for a buildout. Official approval announcement
Five categories make the baseline clearer
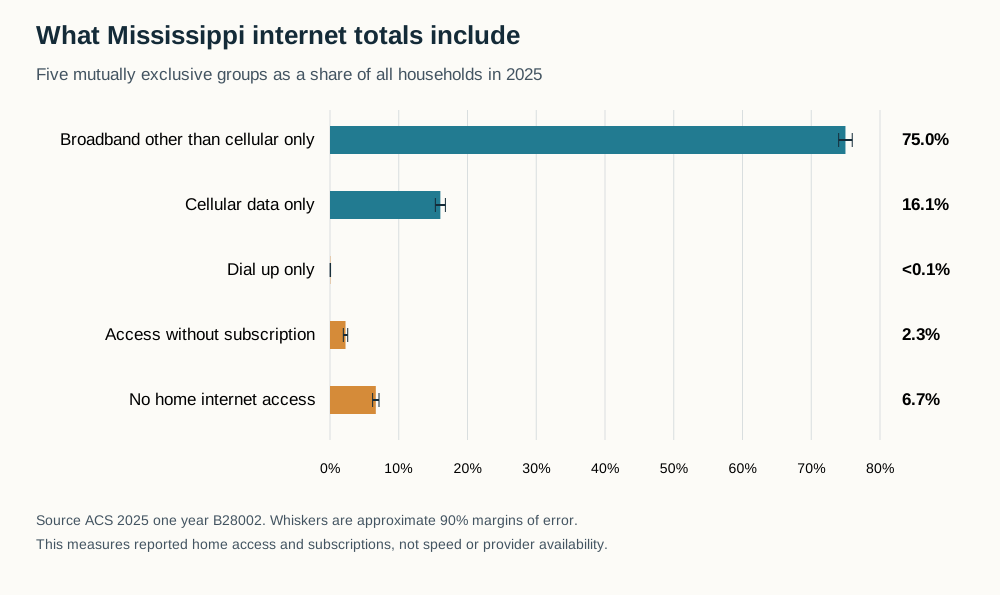
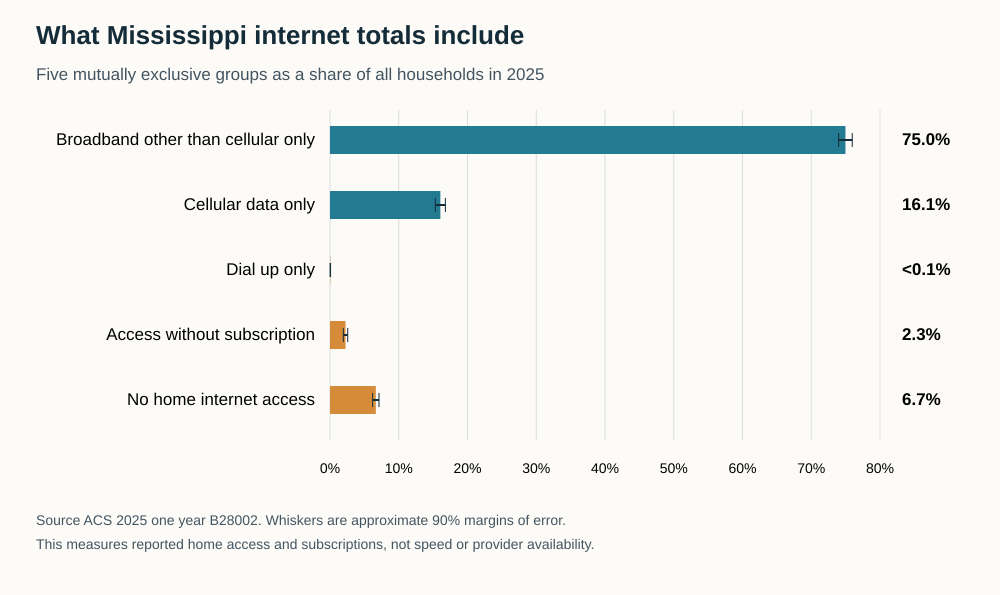
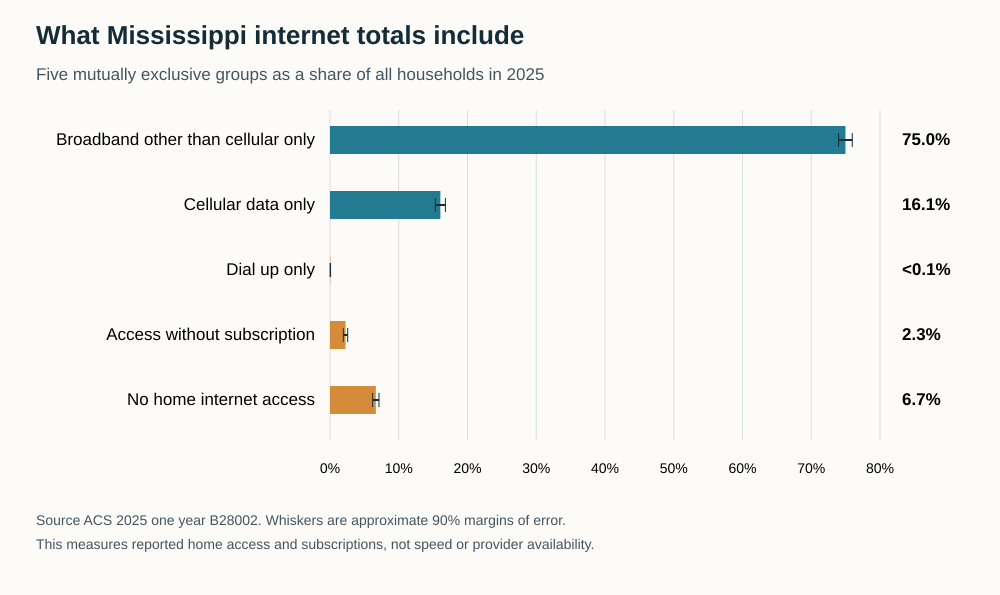
HousingStabilityIQ separated the state’s estimated 1,197,317 households into five nonoverlapping groups:
- 75.0% had broadband subscriptions other than a cellular-only subscription: 897,700 households.
- 16.1% had cellular data as their only subscription type: 192,210 households.
- Less than 0.1% had dial-up alone: 582 households.
- 2.3% reported home internet access without a subscription: 27,037 households.
- 6.7% reported no home internet access: 79,788 households.
Those counts sum to the statewide household total. The displayed percentages may differ slightly from 100% because of rounding. The first category is broad: it can include combinations of subscriptions and is not equivalent to cable, fiber or DSL alone.
| Group / category | Estimated units or households | Denominator | Share ± 90% MOE |
|---|---|---|---|
| Broadband other than cellular only | 897,700 | 1,197,317 | 74.98% ± 0.99 pp |
| Cellular data only | 192,210 | 1,197,317 | 16.05% ± 0.73 pp |
| Dial up only | 582 | 1,197,317 | 0.05% ± 0.03 pp |
| Access without subscription | 27,037 | 1,197,317 | 2.26% ± 0.32 pp |
| No home internet access | 79,788 | 1,197,317 | 6.66% ± 0.46 pp |
Scroll the table horizontally on smaller screens. Full-precision values and definitions are in the chart-data CSV and evidence ZIP.
The cellular-only estimate has a published 90% margin of error of 8,853 households, or an approximate 0.73 percentage points on the all-household denominator. The no-access estimate has a margin of 5,582 households, or 0.46 percentage points. These are weighted survey estimates, not counts of customer accounts.
No subscription does not always mean no access
An estimated 106,825 households had no internet subscription, combining those with access without a subscription and those with no home access. Calling all of them “offline” would erase the distinction the questionnaire makes.
The survey asks about service at the household’s residence. Access elsewhere is not the same measure. Conversely, the presence of a cellular subscription does not establish that everyone in the household has a personal device, can use the connection for every task, or receives reliable service. The Census questions do not measure download speeds, data caps or the price households pay. 2025 questionnaire
A second accounting trap is adding the broad technology totals. The table lists cellular, cable/fiber/DSL and satellite subscriptions, but households can have more than one. Those totals overlap. The five-group breakdown above avoids that double counting by using the explicit cellular-only category and subtracting it from the overall broadband total.
A household measure rather than a coverage map
Mississippi State University Extension has already distinguished broadband of any type from fixed broadband in its analysis using 2022 ACS five-year estimates. The contribution here is a reproducible 2025 one-year partition, not a claim that the distinction is new. Different reference periods and products also mean the earlier report should not be treated as a directly comparable annual baseline.
The current table cannot determine why a household relies on cellular service. Price, preferences, service availability and other explanations would require further evidence. It also cannot show where a provider could install service but has no subscriber, or where no provider offers a qualifying connection. Those are different questions requiring address-level infrastructure information.
For reporters, planners and housing organizations, the practical value is an accurate starting point. “Broadband,” “cellular only,” “no subscription” and “no access” are not interchangeable labels. Keeping them separate helps prevent an encouraging overall subscription percentage from being mistaken for universal access to a particular kind of home service.
The analysis retains the source counts, margins of error, allocation indicators and reconstruction code. Census reports that a six-week disruption to 2025 collection affected sample size and precision; no annual trend, state ranking or causal explanation is claimed. Collection note
Methods and interpretation limits
These are 2025 ACS one-year household cross-sections, not annual trends or national rankings. The collection interruption and changed disclosure/release procedures are disclosed in the archived methodology. Derived 90% margins are approximate and do not capture all nonsampling error.
The complete 44-comparison family is retained. Maine electricity, oil and utility-gas tenure contrasts pass the conservative adjustment; neither New Mexico facilities rate contrast passes. Individual chart intervals are not simultaneous intervals.
This research remains separate from the site’s five-year structural housing score and does not modify the score, calculator or database.
The exclusive partition distinguishes cellular-only broadband, other broadband, dial-up-only, access without subscription and no home access. Technology totals can overlap. Household reports do not measure speed, provider availability, price, devices or BEAD results.
Read the full archived methodology. The evidence ZIP preserves frozen source files, source provenance and reproduction scripts.
Sources and context
Data and chart downloads
The evidence download is shared with the related studies that use the same source files. Keep the original folder layout when extracting it. Source and sensitivity records retained for reproducibility do not constitute additional published stories.