Mortgage-free costs · 2025 research
Housing costs persist after mortgage payoff across three large metro areas
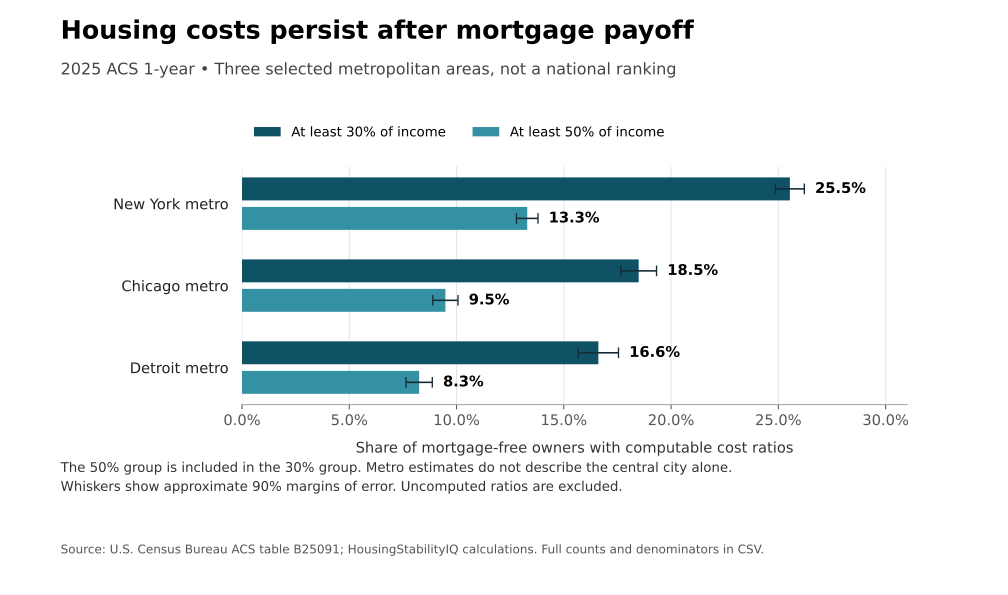
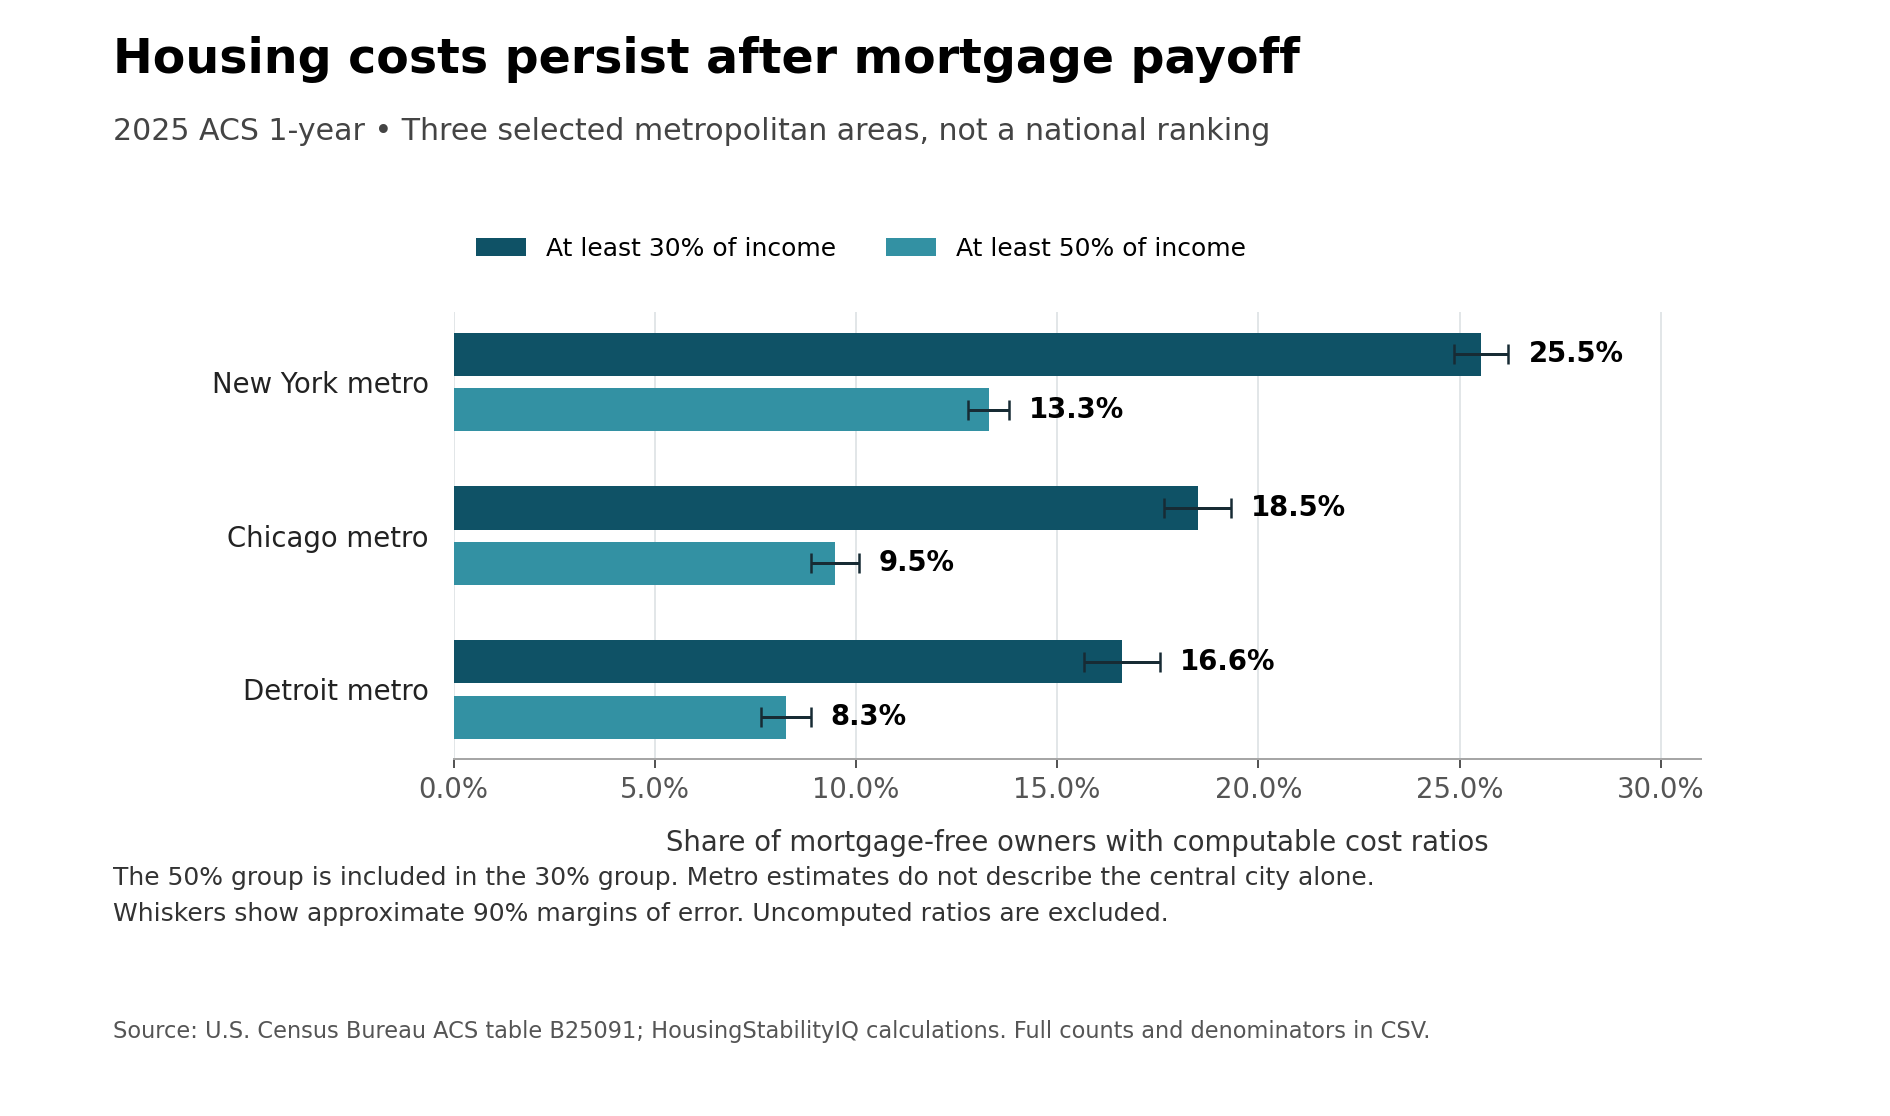
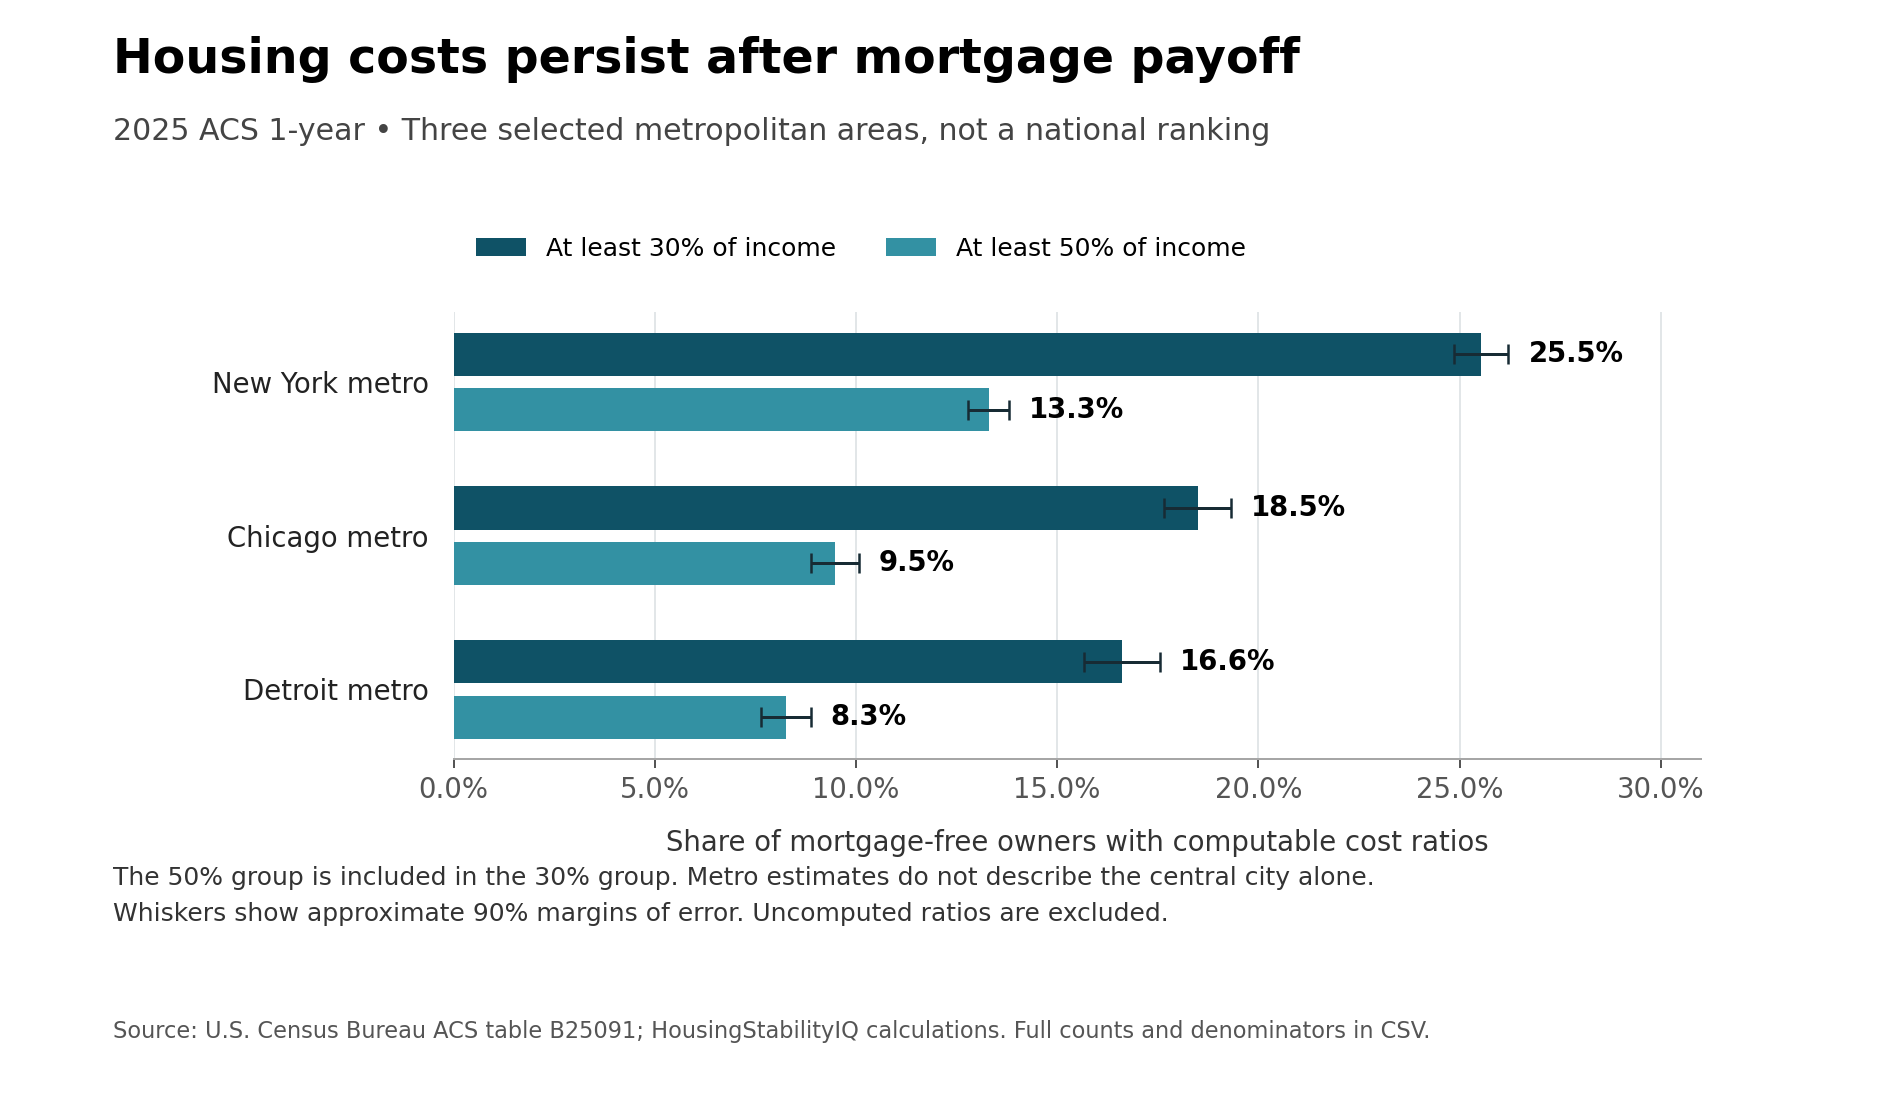
Owning a home without a mortgage leaves a substantial number of households facing high recurring costs in the New York, Chicago and Detroit metropolitan areas. New Census estimates show that at least 30% of household income went toward selected owner costs for 25.5% of mortgage-free owners in the New York metro, 18.5% in Chicago and 16.6% in Detroit, among households whose ratios could be calculated. 2025 ACS table B25091
HousingStabilityIQ’s analysis translates those rates into an estimated 395,463 households in the New York–Newark–Jersey City, NY–NJ region; 166,194 in Chicago–Naperville–Elgin, IL–IN; and 88,115 in Detroit–Warren–Dearborn, MI. The three selected regions are a comparison, not a national ranking or a representative sample of every housing market.
These figures describe existing owners, not the cost of buying a home today. The survey compares housing expenses with household income. It does not measure a property’s equity or a household’s savings, and mortgage-free does not necessarily mean retired or free of other debts.
| Group / measure | Estimated households | Denominator | Share ± 90% MOE |
|---|---|---|---|
| New York metro · Costs ≥30% of income | 395,463 | 1,548,539 | 25.54% ± 0.67 pp |
| New York metro · Costs ≥50% of income | 205,873 | 1,548,539 | 13.29% ± 0.50 pp |
| Chicago metro · Costs ≥30% of income | 166,194 | 898,831 | 18.49% ± 0.83 pp |
| Chicago metro · Costs ≥50% of income | 85,215 | 898,831 | 9.48% ± 0.59 pp |
| Detroit metro · Costs ≥30% of income | 88,115 | 530,466 | 16.61% ± 0.94 pp |
| Detroit metro · Costs ≥50% of income | 43,794 | 530,466 | 8.26% ± 0.61 pp |
Scroll the table horizontally on smaller screens. Full-precision values and definitions are in the chart-data CSV and evidence ZIP.
The bills that remain
Selected owner costs include applicable property taxes, insurance, utilities and required association or condominium fees. The table combines those costs rather than identifying which one produces a household’s burden. A high ratio can reflect limited income, substantial expenses or both. Census measurement note
A more demanding threshold also affects substantial numbers. Selected costs consumed at least half of income for 205,873 mortgage-free households in the New York metro, or 13.3%; 85,215 in Chicago, or 9.5%; and 43,794 in Detroit, or 8.3%. These households are already included in each region’s 30%-or-more group and must not be counted twice.
The current broad-burden estimates have approximate 90% margins of error of 0.67 percentage points in New York, 0.83 in Chicago and 0.94 in Detroit. The accompanying chart displays that uncertainty instead of turning small year-to-year movements into its headline.
A regional measure cannot diagnose a local tax bill
The metro boundaries extend beyond their namesake cities. Cook County, for example, offers a Homeowner Exemption that reduces assessed value rather than providing a fixed-dollar tax-bill reduction. Detroit’s HOPE program has its own eligibility process for city residents. Neither program covers every household in its corresponding metropolitan estimate. The Census figures cannot measure program eligibility, take-up or effectiveness. Cook County Treasurer Detroit HOPE
The figures also leave out households whose ratio was not computed: 18,709 in New York, 9,606 in Chicago and 9,864 in Detroit. The denominators are therefore 1,548,539, 898,831 and 530,466, respectively. Exclusion, which can affect households with zero or negative income, is not a finding of financial security.
The annual comparison remains cautious
New York’s two burden rates are higher than their 2024 estimates and clear individual approximate 90% comparisons. Neither increase survives correction across all 12 comparisons in the original six-market study. Chicago’s and Detroit’s changes do not clear even the individual tests. An inconclusive comparison is not proof of no change.
Census reports that 2025 collection was interrupted for six weeks, alongside separate changes to population controls and disclosure processing. Collection Controls Processing
The defensible finding is the continuing scale of housing costs after mortgage payoff across these three regions, not a claim of a new nationwide surge. Understanding which households need assistance, and which costs matter most, requires evidence beyond mortgage status alone.
Methods and interpretation limits
These are ACS one-year research estimates, separate from HousingStabilityIQ’s five-year scores. Approximate 90% margins of error use the Census subset-proportion formula and root-sum-of-squares for component sums or differences; covariance is unavailable. Sampling uncertainty does not include every reporting, coverage or processing error.
Census reports a six-week interruption to 2025 collection, changes to population controls and changes to disclosure processing. These limitations accompany the estimates. The owner-cost and required-fee comparisons retain the original 12-test family and the 2024 questionnaire change. An inconclusive annual comparison is not proof of no change.
Read the full archived methodology. The evidence ZIP preserves frozen source files, source provenance and reproduction scripts.
Sources and context
Data and chart downloads
The evidence download is shared with the related studies that use the same source files. Keep the original folder layout when extracting it. Source and sensitivity records retained for reproducibility do not constitute additional published stories.