NYC EV denominators · 2025 research
New York City renter EV comparisons change when households without vehicles are separated
HousingStabilityIQ analysis of 2025 American Community Survey estimates
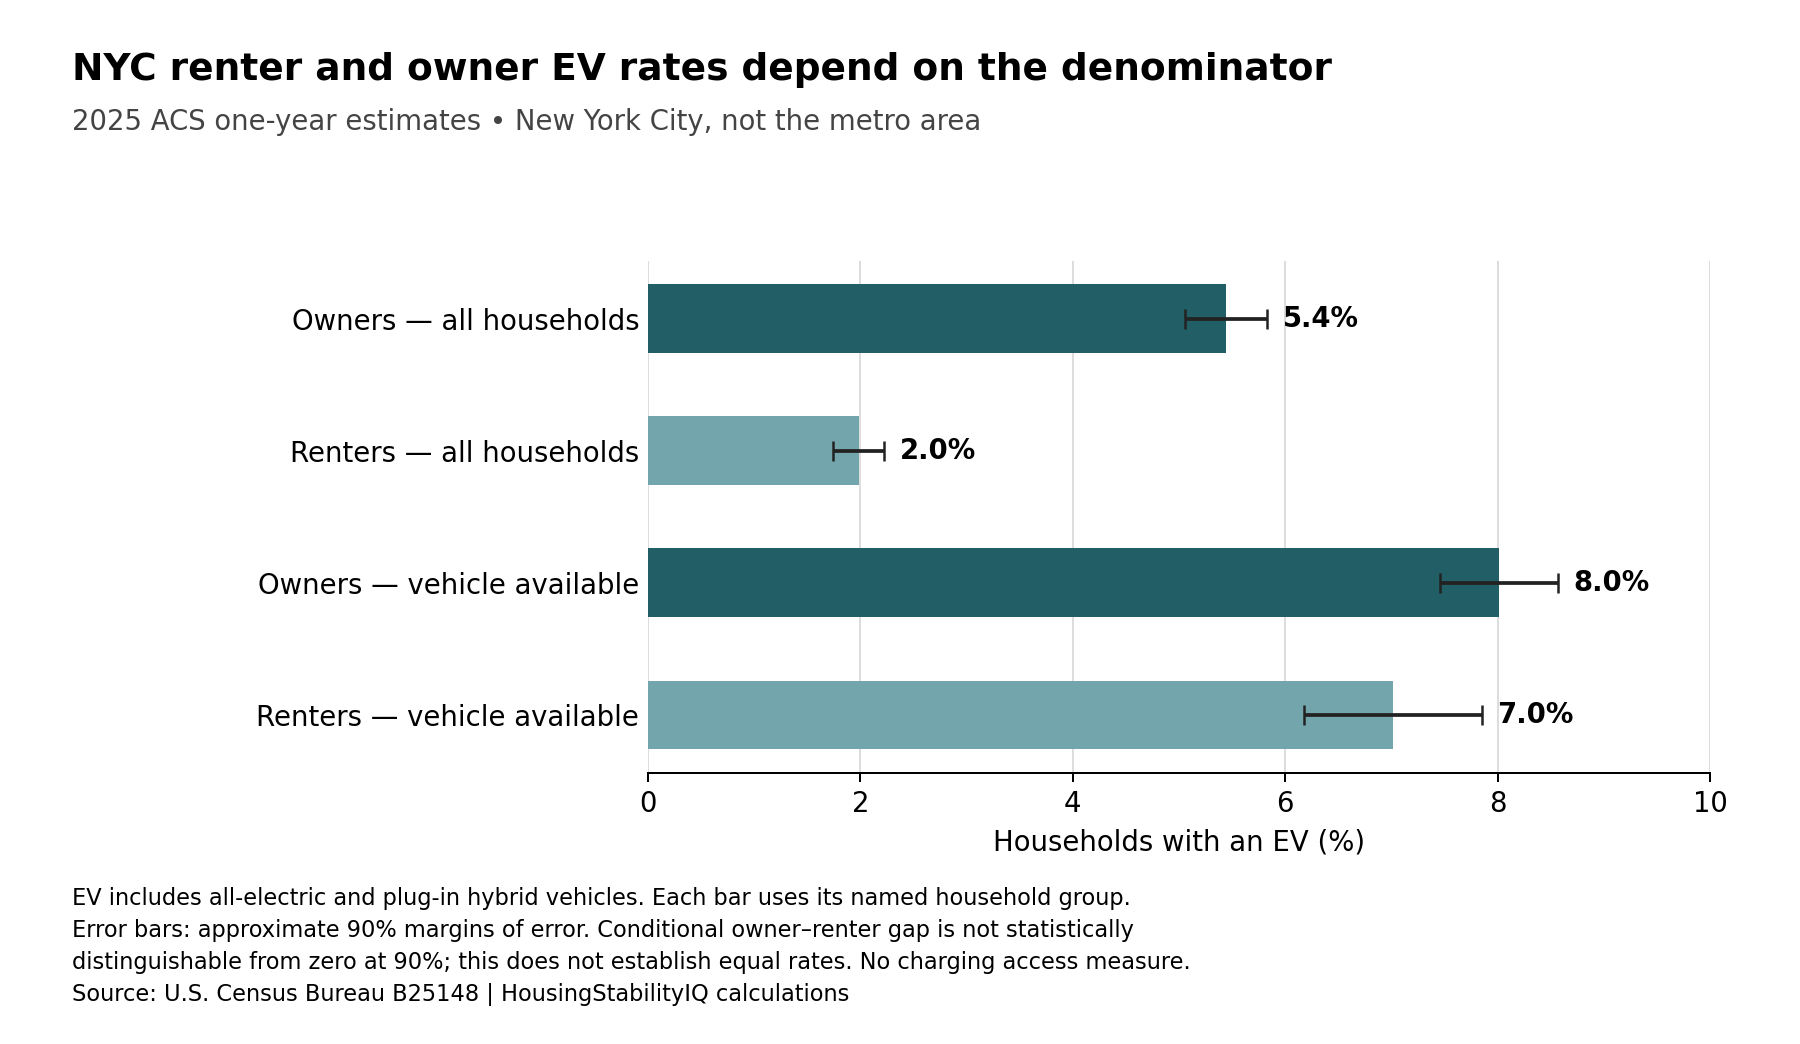
New York City homeowners appear much more likely than renters to have an electric vehicle when every household is counted. The comparison looks different when it is limited to households with at least one vehicle available: an estimated 8.0% for owners and 7.0% for renters.
The distinction comes from HousingStabilityIQ’s analysis of the new 2025 American Community Survey table linking housing tenure, vehicle availability and electric vehicles. Across all owner households, 5.4% had an EV, compared with 2.0% of renter households. But 71.7% of the city’s renter households had no vehicle available at all, compared with 32.1% of owner households.
An all-household comparison therefore answers a broader question than an EV comparison among households that already have vehicles. Neither denominator is inherently wrong. They describe different populations, and confusing them can turn a housing-tenure statistic into an unsupported story about charging access or purchasing preferences.
| Group / measure | Estimated households | Denominator | Share ± 90% MOE |
|---|---|---|---|
| Owners · all households | 59,952 | 1,101,682 | 5.44% ± 0.38 pp |
| Renters · all households | 45,840 | 2,310,907 | 1.98% ± 0.24 pp |
| Owners · vehicle available | 59,952 | 748,495 | 8.01% ± 0.56 pp |
| Renters · vehicle available | 45,840 | 653,590 | 7.01% ± 0.84 pp |
Scroll the table horizontally on smaller screens. Full-precision values and definitions are in the chart-data CSV and evidence ZIP.
The numerator stays the same
The Census estimates 59,952 owner households and 45,840 renter households with at least one EV. Dividing those figures by all households of each tenure gives the 5.4% and 2.0% shares. The denominators are 1,101,682 owner households and 2,310,907 renter households.
For the vehicle-available comparison, the EV counts do not change. The denominators become 748,495 owner households and 653,590 renter households with at least one vehicle available. That produces the 8.0% and 7.0% estimates. These are New York City’s five boroughs, not the wider metropolitan area or New York State. “Renter” describes the home’s tenure, not whether a vehicle is rented.
Uncertainty matters. The conditional owner share has an approximate 90% margin of error of 0.6 percentage point; the renter share’s margin is 0.8 point. The estimated difference is 0.996 percentage point, with an approximate margin of 1.004 points. Its interval extends from about −0.01 to 2.00 points, so this calculation does not distinguish the conditional rates at the 90% confidence level. That is not proof they are equal.
What the comparison cannot explain
The Census definition includes all-electric and plug-in hybrid vehicles, but not conventional hybrids that cannot plug in. It counts occupied homes with an EV, not vehicles, drivers, registrations or chargers. The question was introduced in 2025, making this a baseline rather than evidence of change from 2024.
New York’s charging discussion is already active. In an August 4 announcement, the Department of Transportation described plans for 600 additional curbside charging points and emphasized neighborhoods with limited off-street parking. The ACS table does not measure parking arrangements, chargers, electricity costs, travel needs or the effect of that rollout. It also cannot establish why a household has no vehicle.
The new variable has processing limitations as well. Electric-vehicle information was allocated for about 10.0% of the city’s occupied homes with a vehicle available, according to the separate allocation table. This is not a tenure-specific allocation rate, and sampling margins do not capture every reporting or processing error.
For housing and transportation reporting, the useful lesson is to identify the population before interpreting the gap. A renter household without a vehicle is not automatically a household missing an EV charger. Separating those questions creates a more accurate starting point for examining residents’ infrastructure needs.
Methods and interpretation limits
These are ACS one-year research estimates, separate from HousingStabilityIQ’s five-year scores. Approximate 90% margins of error use the Census subset-proportion formula and root-sum-of-squares for component sums or differences; covariance is unavailable. Sampling uncertainty does not include every reporting, coverage or processing error.
Census reports a six-week interruption to 2025 collection, changes to population controls and changes to disclosure processing. These limitations accompany the estimates. Sewer, solar and EV questions are first-year 2025 measures; they do not support a 2024–2025 trend.
Read the full archived methodology. The evidence ZIP preserves frozen source files, source provenance and reproduction scripts.
Sources and context
Data and chart downloads
The evidence download is shared with the related studies that use the same source files. Keep the original folder layout when extracting it. Source and sensitivity records retained for reproducibility do not constitute additional published stories.