Pittsburgh home ages · 2025 research
Pittsburgh’s older homes span generations, not just older owners
New Census estimates connect the age of the householder with the age of the home—and show why the distinction matters.
An estimated 149,856 owner-occupied homes in the Pittsburgh metropolitan area had two characteristics in 2025: the householder was at least 65 years old, and the building was constructed before 1960.
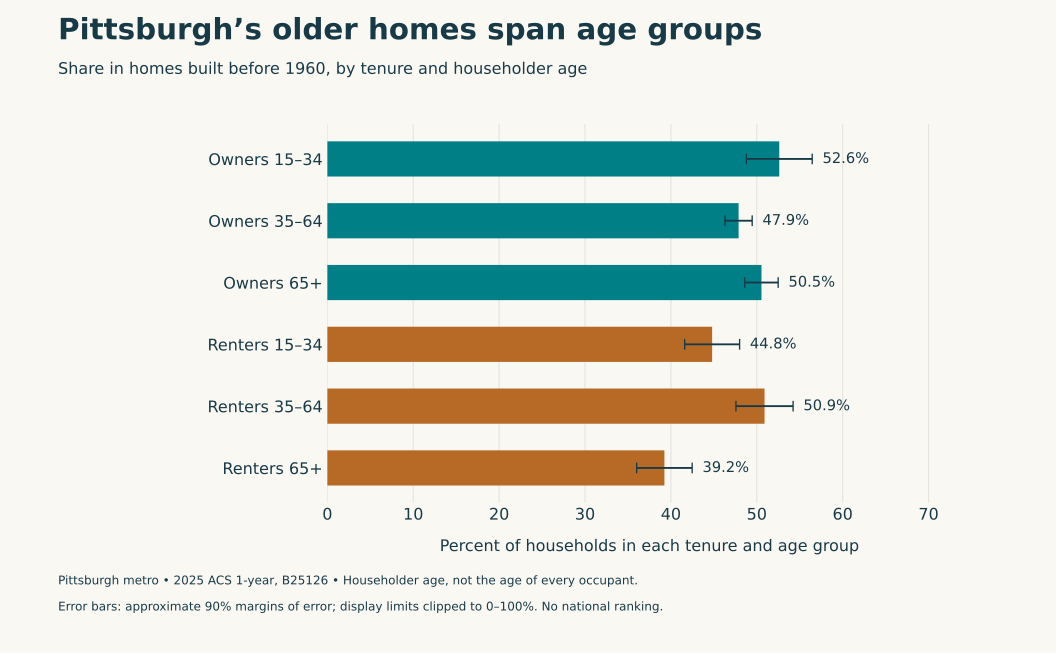
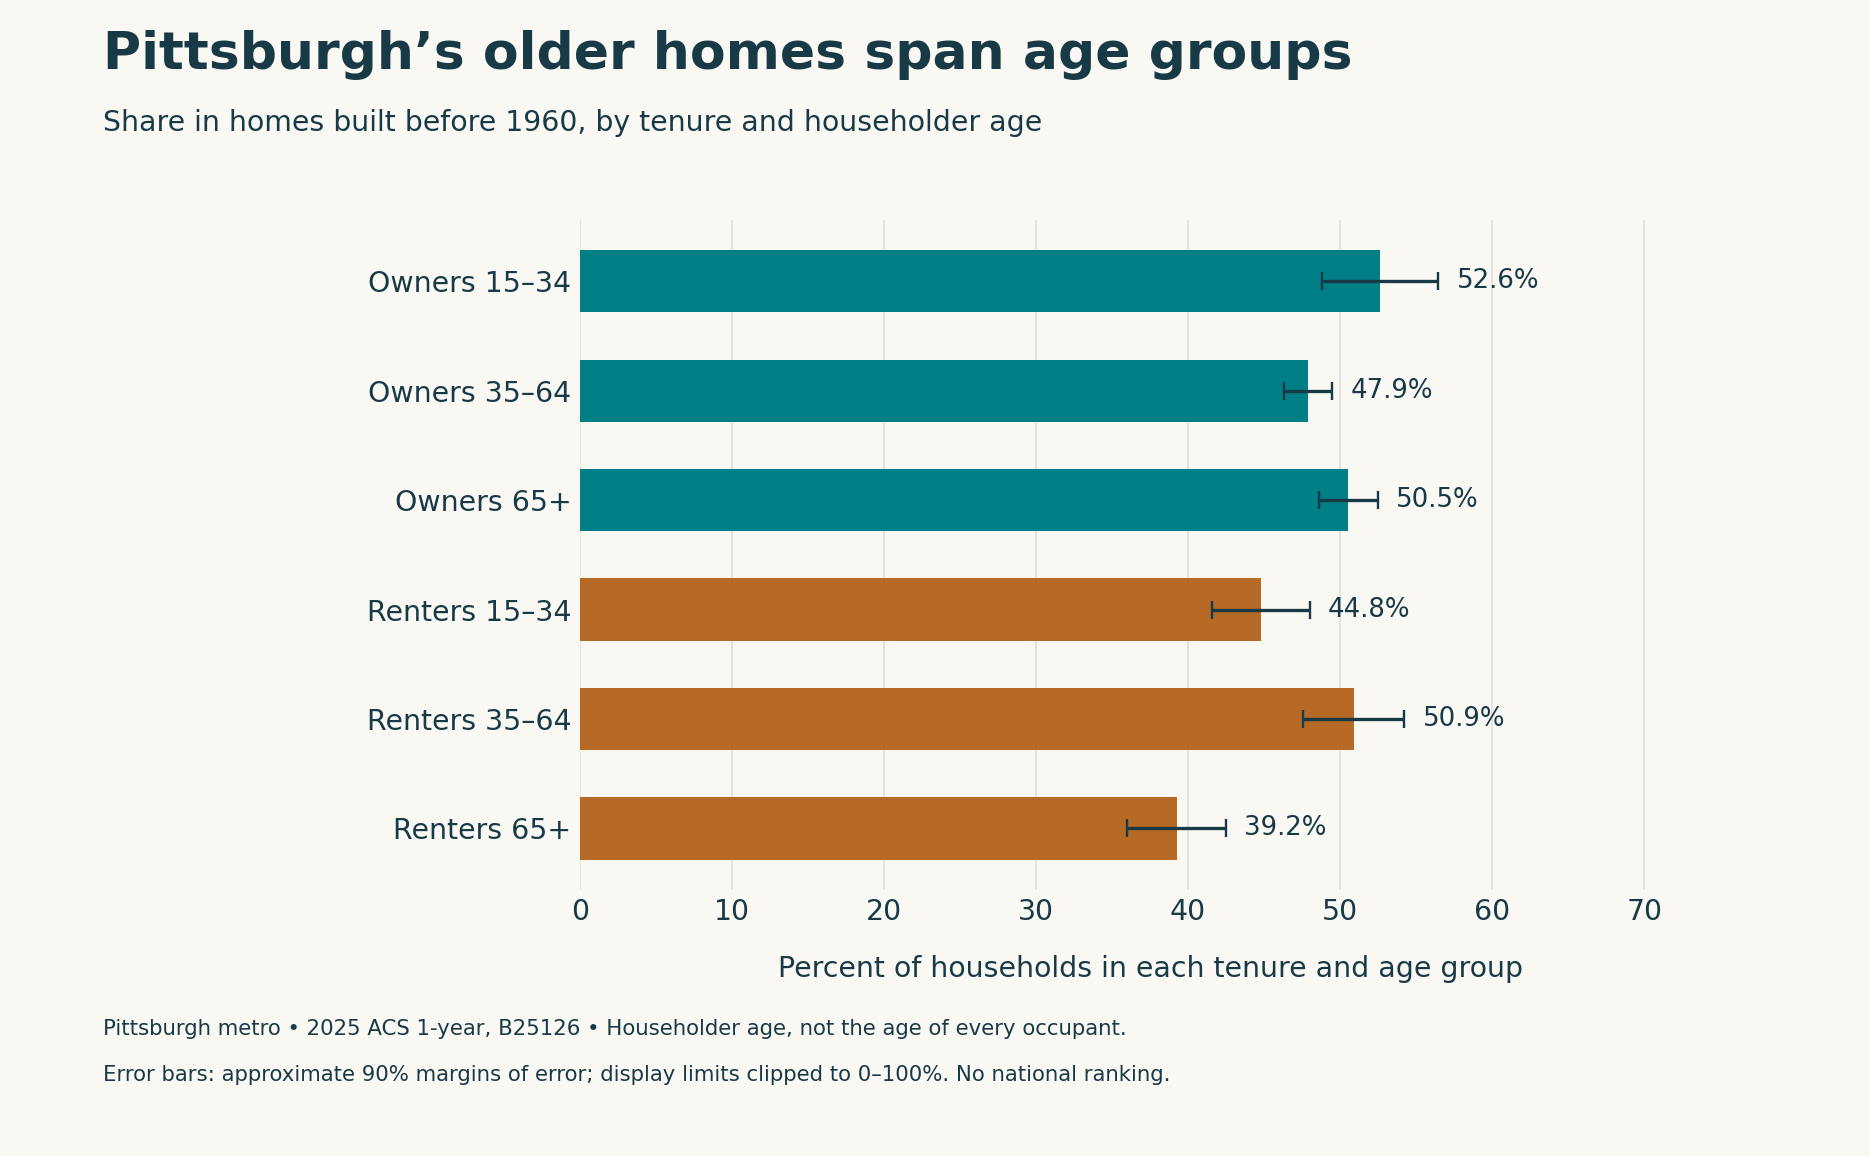
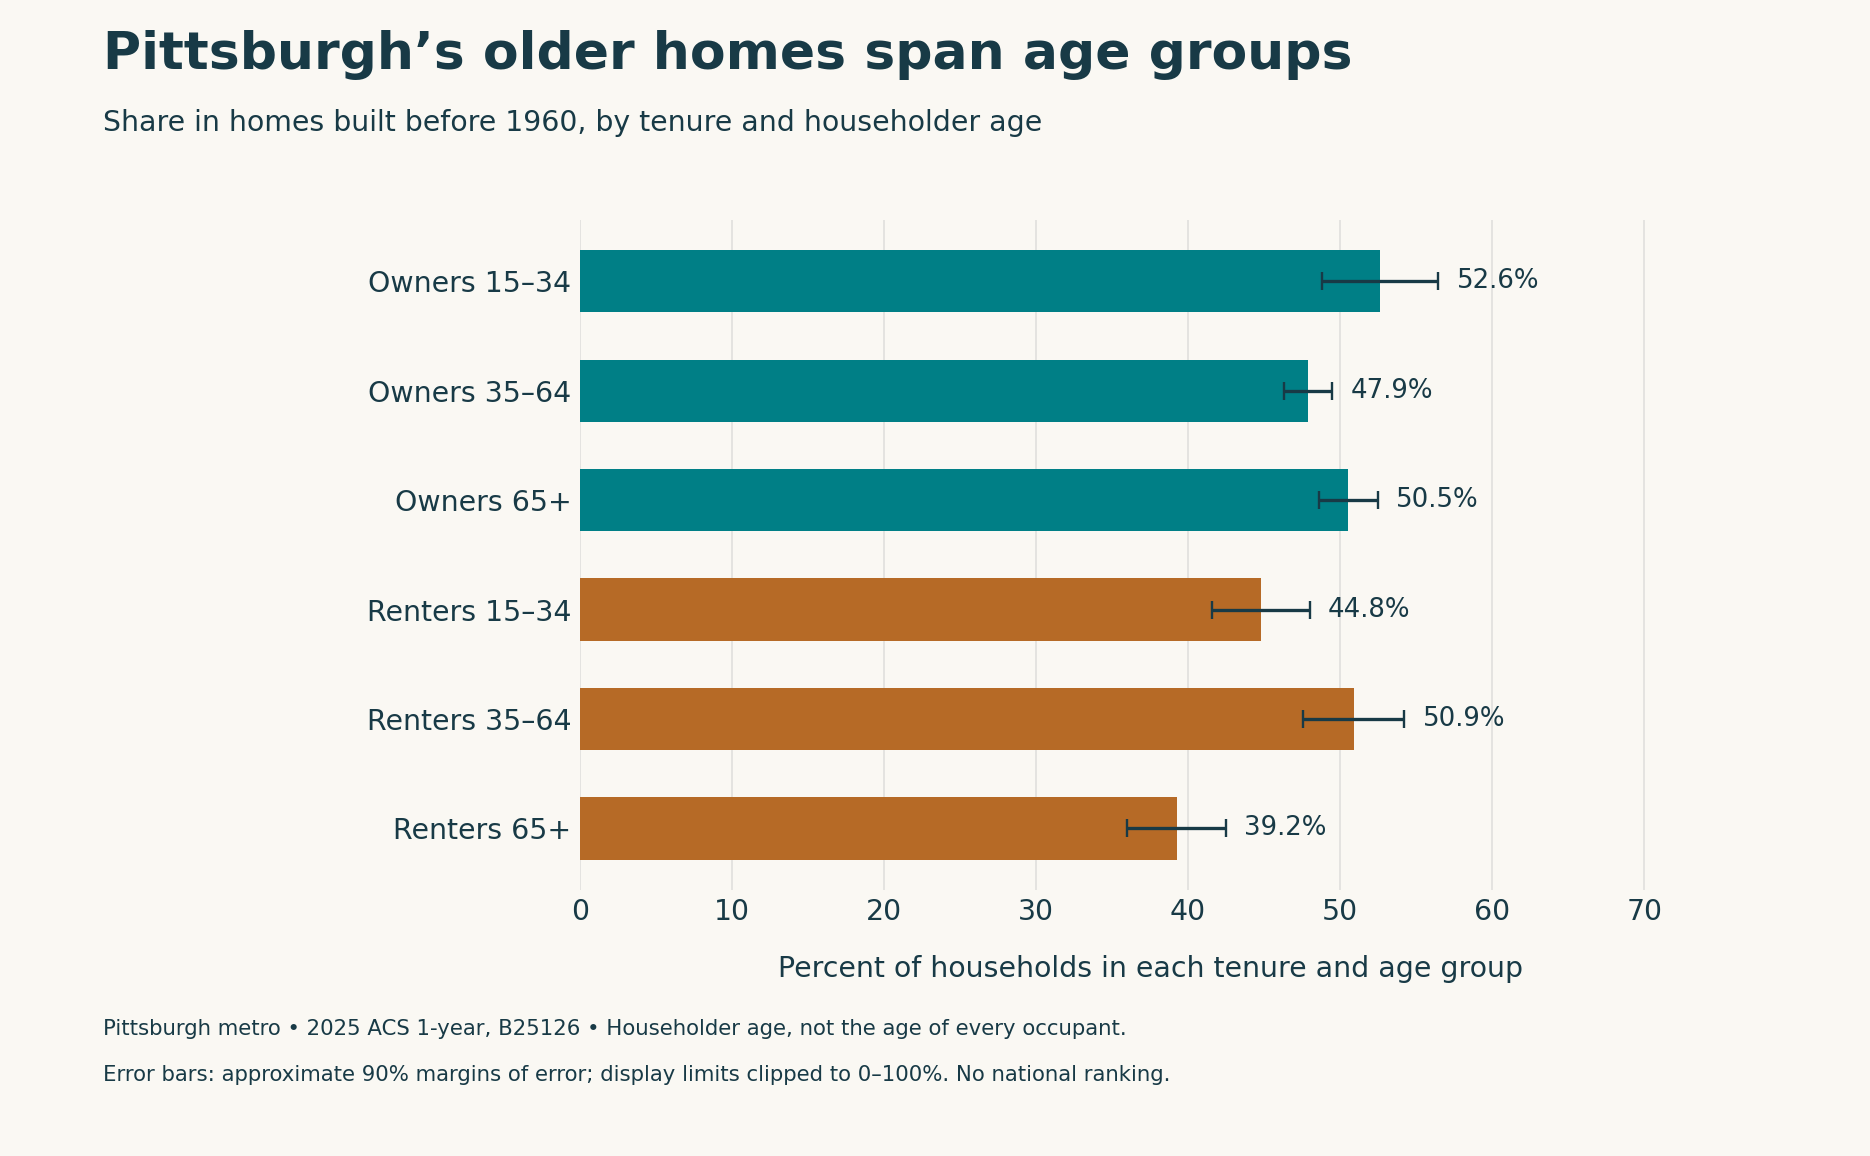
That is about half—50.5%—of the region’s 296,489 owner households in that age group. But pre-1960 homes are also an important part of younger adults’ housing: 42,730 owner households headed by someone ages 15 to 34 lived in them, or 52.6% of that group. These are estimates of households, not counts of older or younger people. Source: 2025 American Community Survey, table B25126.
The point is not that those two percentages are identical. The estimates have uncertainty, and neither establishes a statistically certain majority. Rather, a direct Census cross-tabulation shows that the region’s old housing serves people at different stages of adult life. A discussion framed only around older homeowners leaves out substantial younger-owner and renter populations.
| Group / category | Estimated units or households | Denominator | Share ± 90% MOE |
|---|---|---|---|
| Owners 15–34 | 42,730 | 81,212 | 52.62% ± 3.84 pp |
| Owners 35–64 | 186,108 | 388,701 | 47.88% ± 1.58 pp |
| Owners 65+ | 149,856 | 296,489 | 50.54% ± 1.94 pp |
| Renters 15–34 | 51,176 | 114,234 | 44.80% ± 3.20 pp |
| Renters 35–64 | 65,590 | 128,861 | 50.90% ± 3.33 pp |
| Renters 65+ | 31,166 | 79,420 | 39.24% ± 3.23 pp |
Scroll the table horizontally on smaller screens. Full-precision values and definitions are in the chart-data CSV and evidence ZIP.
Looking beyond the older-owner total
The owner estimates are 52.6% for householders ages 15–34, 47.9% for ages 35–64 and 50.5% for ages 65 and older. The corresponding renter estimates are 44.8%, 50.9% and 39.2%. Every percentage uses its own age-and-tenure group as the denominator; none describes the share of all Pittsburgh residents.
The underlying counts give that distribution another dimension. Pre-1960 buildings housed an estimated 186,108 owner households headed by someone ages 35–64. Among renters, the counts were 51,176 households in the youngest group, 65,590 in the middle group and 31,166 in the oldest group. A count and a percentage answer different questions: the count describes the estimated scale of a group, while the percentage describes how common older housing is within it.
This analysis uses an existing joint table, not an inference made by placing a map of older people beside a map of older buildings. That matters because two characteristics can be common in the same region without occurring in the same households.
A starting point, not a condition report
Building age alone cannot tell a housing provider whether a roof leaks, a doorway accommodates a wheelchair or a household needs financial assistance. Census defines year built as the original construction date, not the date of a later remodel. A thoroughly renovated older building still appears in its original construction category. Source: Census subject definitions.
The local question is well established. The University of Pittsburgh’s 2022 State of Aging, Disability, and Family Caregiving in Allegheny County report examined older householders and housing age using earlier data. The present analysis adds a 2025 metro-wide view across all three adult-householder age groups and both owner and renter occupancy; it does not claim to discover the region’s aging housing stock. Earlier Pitt report.
Pitt’s Healthy Home Laboratory also illustrates why the next questions are more specific than construction year. The university uses a more-than-century-old, multistory house to study technologies and strategies for aging in place. That work concerns what a home can support, not simply how old it is. Healthy Home Laboratory.
For housing planners, the Census cross-tab is therefore a way to define whom to ask next. Which households need accessibility adaptations? Which buildings have already been renovated? Which renters can secure modifications, and which owners can maintain their homes? Those require information this table does not supply.
How to read the numbers
The geography is the Pittsburgh, Pennsylvania metropolitan statistical area, not Pittsburgh city or Allegheny County alone. The figures are 2025 ACS one-year estimates, released in 2026, not measurements of conditions today or a trend over time.
Approximate 90% margins of error are ±1.9 percentage points for the older-owner share and ±3.8 points for the younger-owner share. All six shares and their count and percentage margins are available in the accompanying data. The pre-1960 cutoff is a transparent analytical choice, not an inspection, accessibility or safety standard. The selected regional example is not a national ranking, and the intervals are not adjusted for the wider exploratory screen.
Methods and interpretation limits
These are 2025 ACS one-year estimates for the named metropolitan areas, not their cities alone. Household estimates are not respondent counts. Sampling and nonsampling errors remain; derived 90% margins use approximate formulas without full covariance.
These examples were selected through exploration. Intervals are descriptive, not adjusted for the broader screen; no national ranking, trend, causal effect, equality or statistically certain majority is claimed. Keep each table’s stated denominator.
This research is separate from the site’s five-year structural housing score. It does not change the score, calculator or source database.
Pre-1960 construction is not an inspection, accessibility or safety standard. The older-owner estimate is 50.5% ±1.9 percentage points, not a statistically certain majority; no equality with younger owners is established.
Read the full archived methodology. The evidence ZIP preserves frozen source files, source provenance and reproduction scripts.
Sources and context
Data and chart downloads
The evidence download is shared with the related studies that use the same source files. Keep the original folder layout when extracting it. Source and sensitivity records retained for reproducibility do not constitute additional published stories.