Raleigh-area septic · 2025 research
The Raleigh area septic picture changes sharply at the county line
HousingStabilityIQ analysis of 2025 American Community Survey estimates
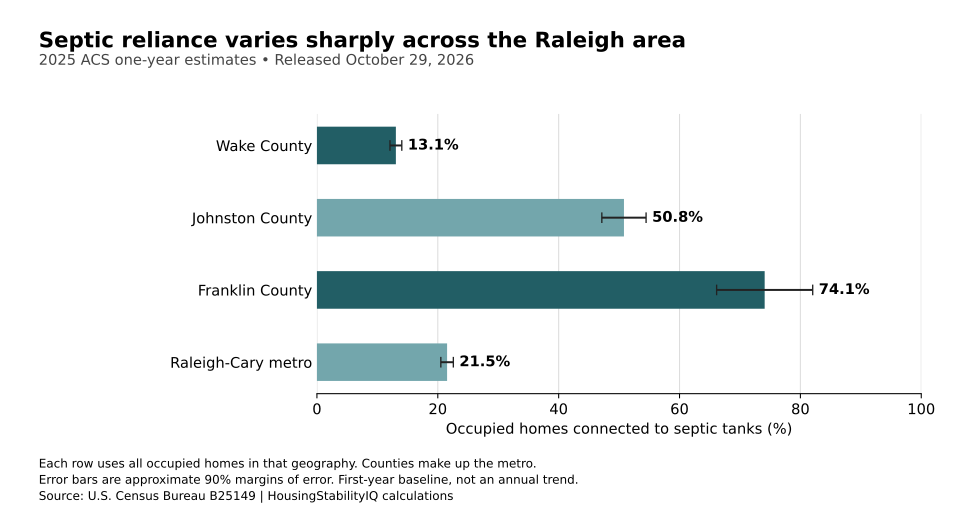
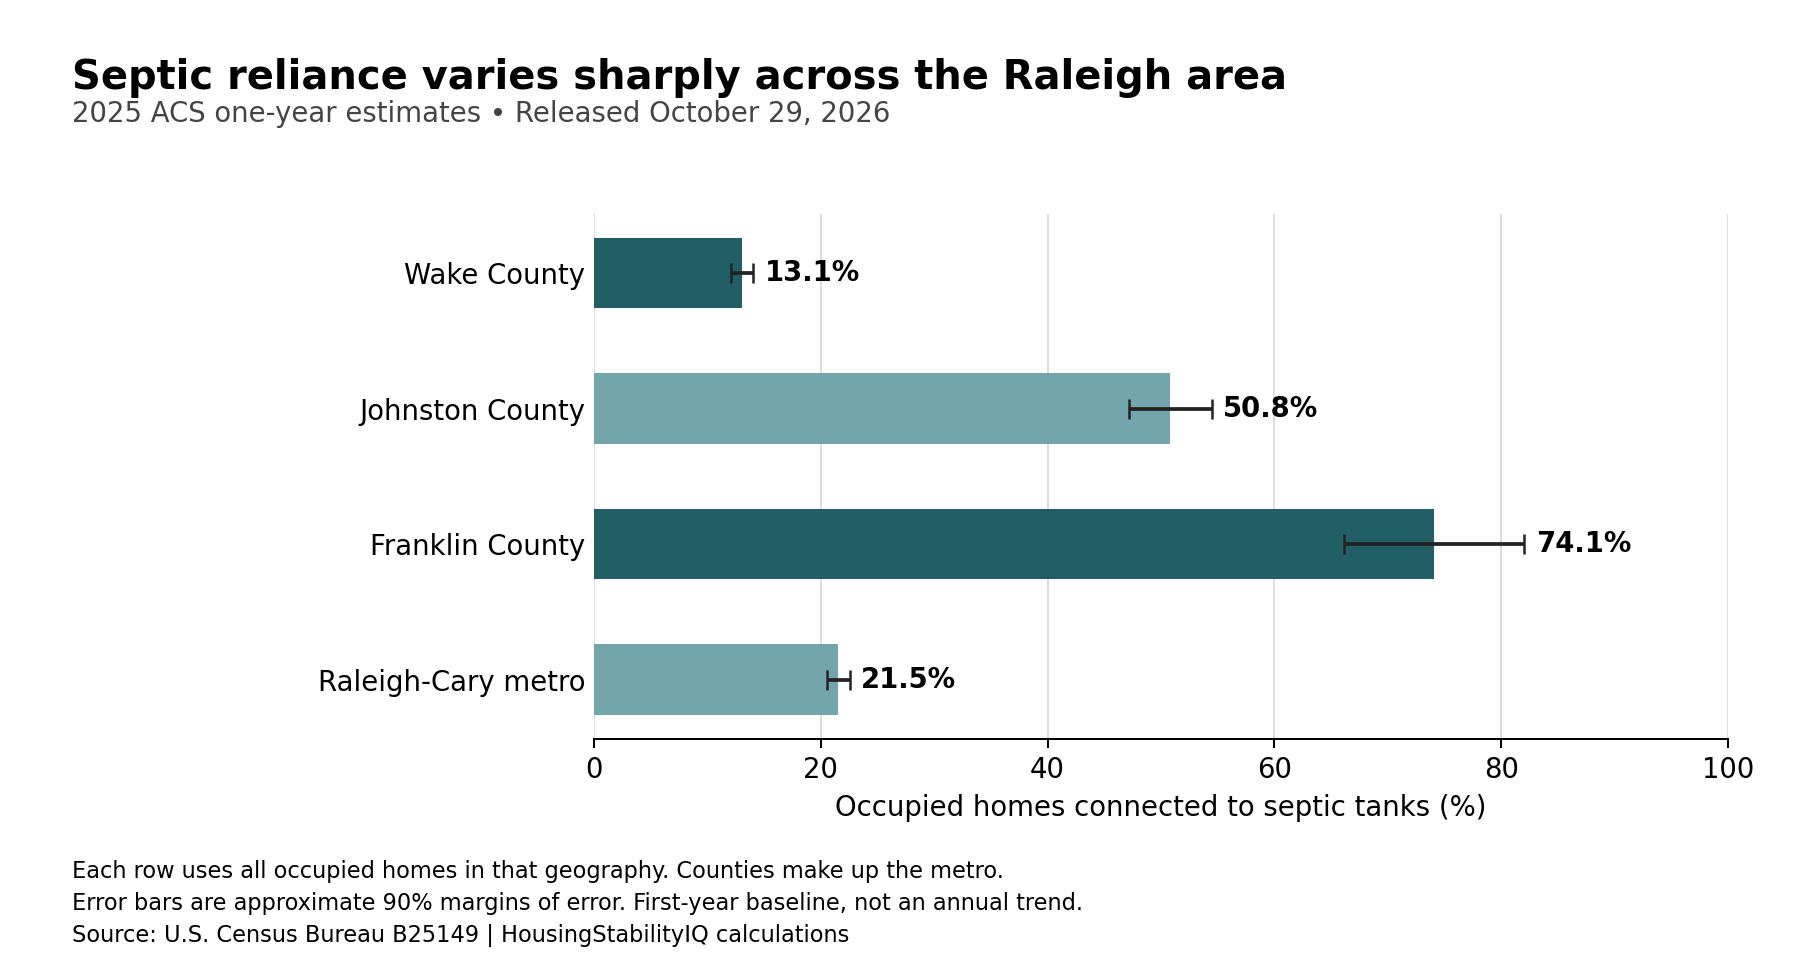
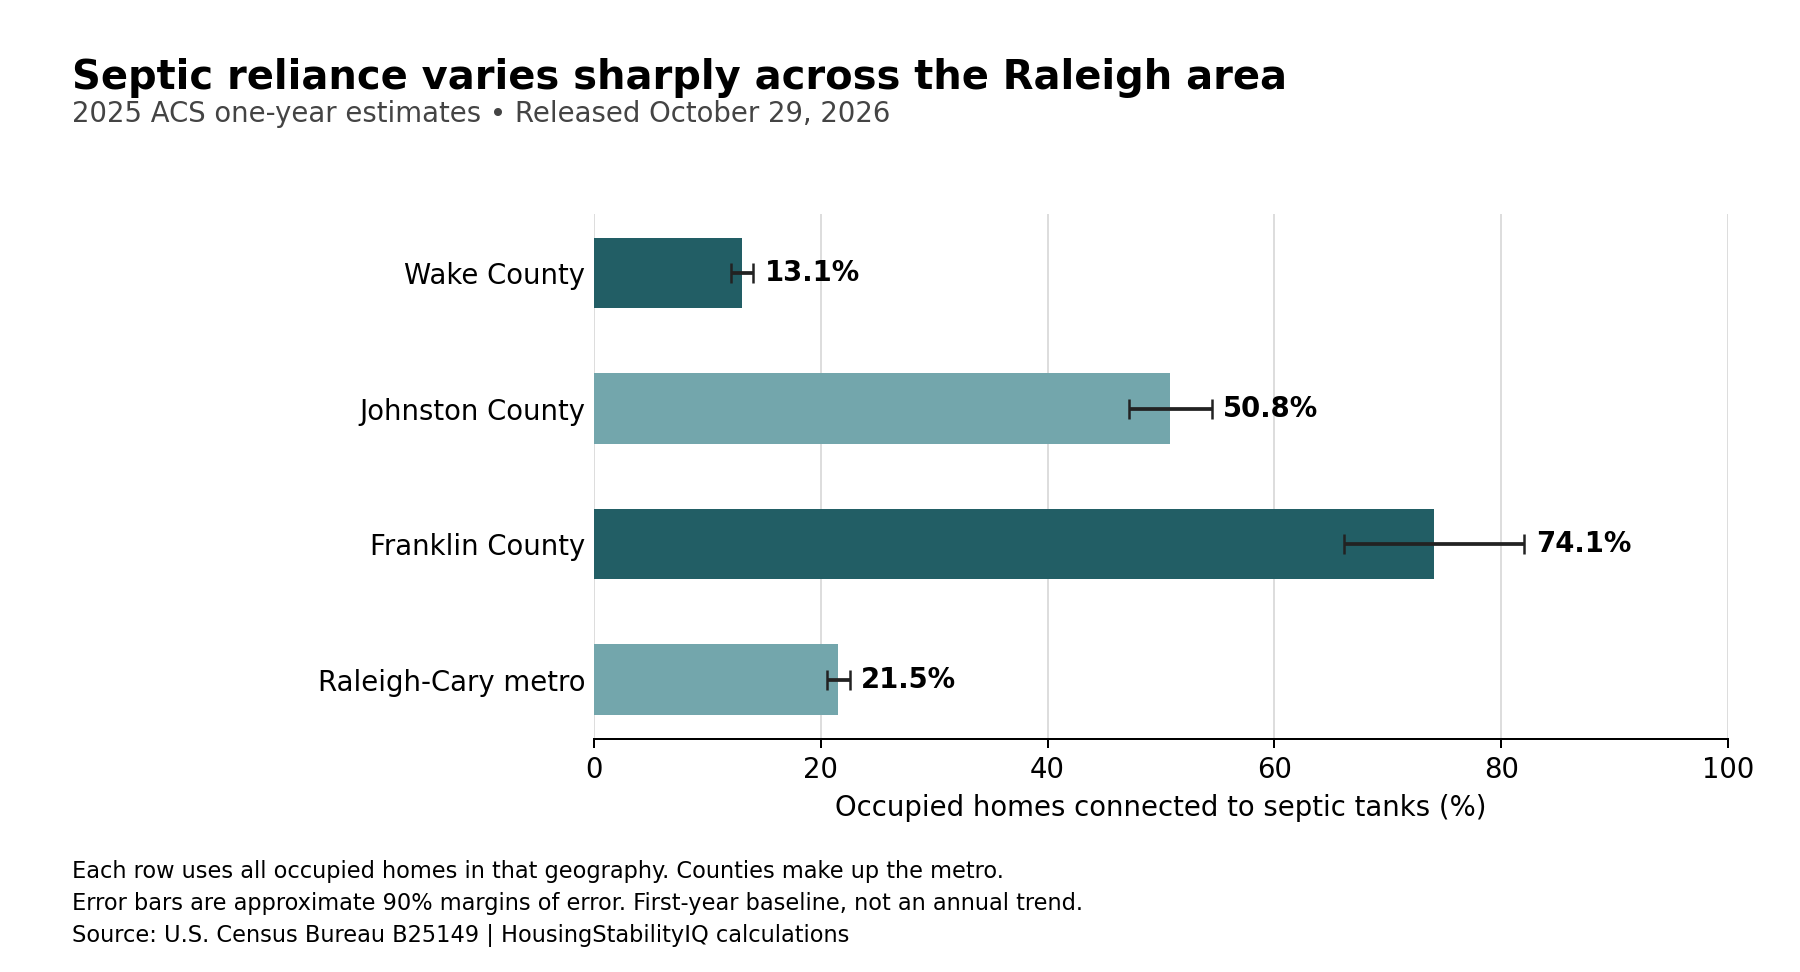
About one in five occupied homes in the Raleigh-Cary metropolitan area uses a septic tank. But that regional figure conceals very different housing infrastructure across the three counties: an estimated 13.1% in Wake, 50.8% in Johnston and 74.1% in Franklin.
HousingStabilityIQ calculated those shares from the Census Bureau’s new sewer-system table in the 2025 American Community Survey, released October 29, 2026. Across the metro, an estimated 135,925 of 631,088 occupied homes were connected to septic tanks, or 21.5%. The approximate 90% margin of error is 1.0 percentage point.
The county comparison adds something a regional average cannot. A discussion based only on Wake’s rate would understate septic reliance in the surrounding metro. A discussion based only on Franklin’s rate would describe a much smaller share of the region’s total housing. These are countywide estimates, not measurements of the cities of Raleigh or Cary, individual subdivisions or proposed development sites.
| Group / measure | Estimated households | Denominator | Share ± 90% MOE |
|---|---|---|---|
| Wake County · septic | 66,458 | 508,700 | 13.06% ± 0.98 pp |
| Johnston County · septic | 46,278 | 91,089 | 50.81% ± 3.66 pp |
| Franklin County · septic | 23,189 | 31,299 | 74.09% ± 7.95 pp |
| Raleigh-Cary metro · septic | 135,925 | 631,088 | 21.54% ± 1.03 pp |
Scroll the table horizontally on smaller screens. Full-precision values and definitions are in the chart-data CSV and evidence ZIP.
A lower share can still mean more homes
Wake had an estimated 66,458 occupied homes connected to septic tanks, compared with 46,278 in Johnston and 23,189 in Franklin. Wake therefore had the largest estimated number among these three counties even though it had the lowest percentage. The denominators explain the difference: Wake had 508,700 occupied homes overall, Johnston 91,089 and Franklin 31,299.
Sampling uncertainty is larger in Franklin. Its estimated septic share carries an approximate 90% margin of error of 7.9 percentage points, compared with 3.7 points in Johnston and 1.0 point in Wake. The broad differences remain substantial, but the percentages should not be read as exact household counts or precise planning forecasts.
The distinction between counts and shares matters for local reporting. A county where septic serves a smaller proportion of housing can still have many households to reach with maintenance information. A county where it serves most homes faces a different infrastructure mix. The estimates identify that mix; they do not determine which public investment is best.
A baseline rather than a system inspection
The Census Bureau added the current sewer question in 2025. Respondents identify public sewer, septic tank or another system. Consequently, this release supplies a new ACS baseline, not evidence that septic use increased or decreased during the past year. The analysis keeps the “other” category separate rather than treating every home without public sewer as septic-connected.
Wake’s One Water Plan already addresses wastewater alongside other water needs. The ACS figures offer a complementary household perspective. They are not a count of permitted systems, an inspection record or a finding that tanks are failing. One system need not correspond to one occupied housing unit, so administrative inventories should not be substituted for these denominators.
There is also measurement uncertainty beyond sampling. In the separate Census allocation table, sewer information was allocated for 7.8% of all metro housing units. That quality measure includes vacant units and cannot be interpreted as the nonresponse rate among the occupied homes analyzed here.
The useful next question is how each county’s existing services reach households using different wastewater systems. Answering it requires local records and reporting. What the new data establish is narrower but important: the Raleigh area does not have one uniform housing-infrastructure profile.
Methods and interpretation limits
These are ACS one-year research estimates, separate from HousingStabilityIQ’s five-year scores. Approximate 90% margins of error use the Census subset-proportion formula and root-sum-of-squares for component sums or differences; covariance is unavailable. Sampling uncertainty does not include every reporting, coverage or processing error.
Census reports a six-week interruption to 2025 collection, changes to population controls and changes to disclosure processing. These limitations accompany the estimates. Sewer, solar and EV questions are first-year 2025 measures; they do not support a 2024–2025 trend.
Read the full archived methodology. The evidence ZIP preserves frozen source files, source provenance and reproduction scripts.
Sources and context
Data and chart downloads
The evidence download is shared with the related studies that use the same source files. Keep the original folder layout when extracting it. Source and sensitivity records retained for reproducibility do not constitute additional published stories.