Original research · 2025 American Community Survey
Renter housing costs in Florida Georgia and North Carolina in 2025
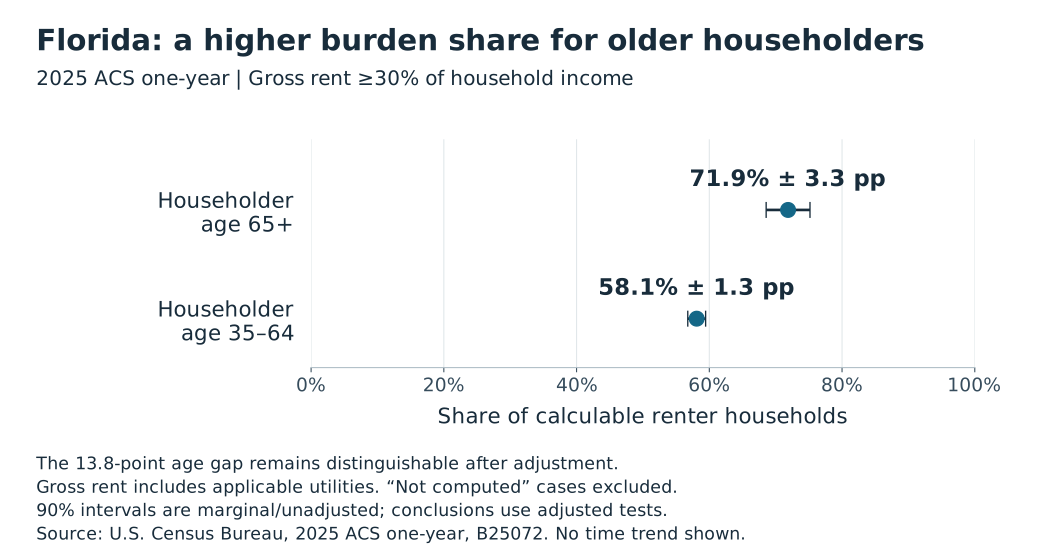
Nearly 72% of Florida renter households whose householder was age 65 or older spent at least 30% of household income on rent and applicable utilities in 2025, among households for which that ratio could be calculated. The estimate was 58% for households with householders ages 35–64, a gap of 13.8 percentage points.
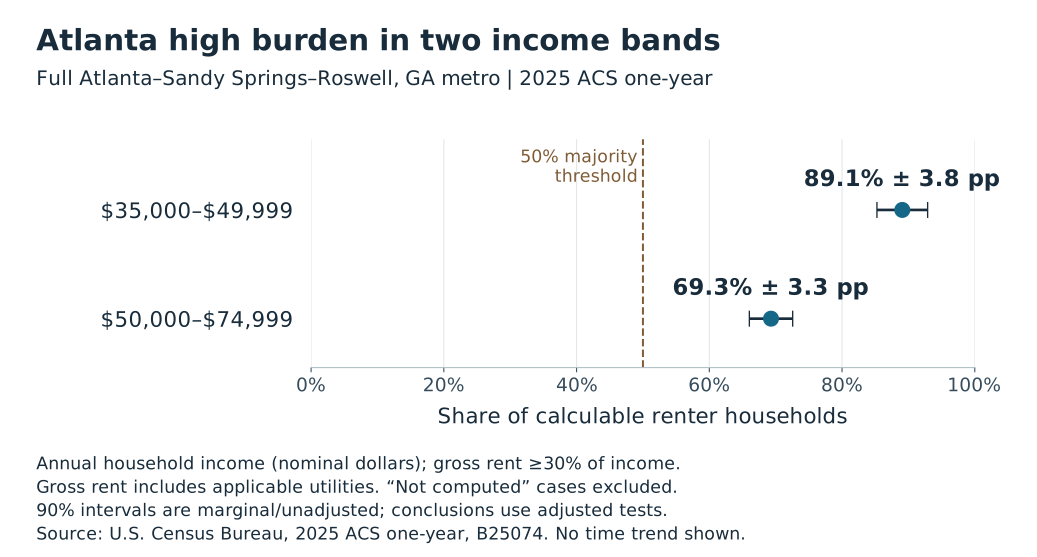
HousingStabilityIQ’s analysis of U.S. Census Bureau survey estimates also finds substantial housing costs relative to income in two Atlanta-area household-income bands. Among renter households with annual household income of $50,000–$74,999 with a calculable rent-to-income ratio, about seven in ten spent at least 30% on gross rent.
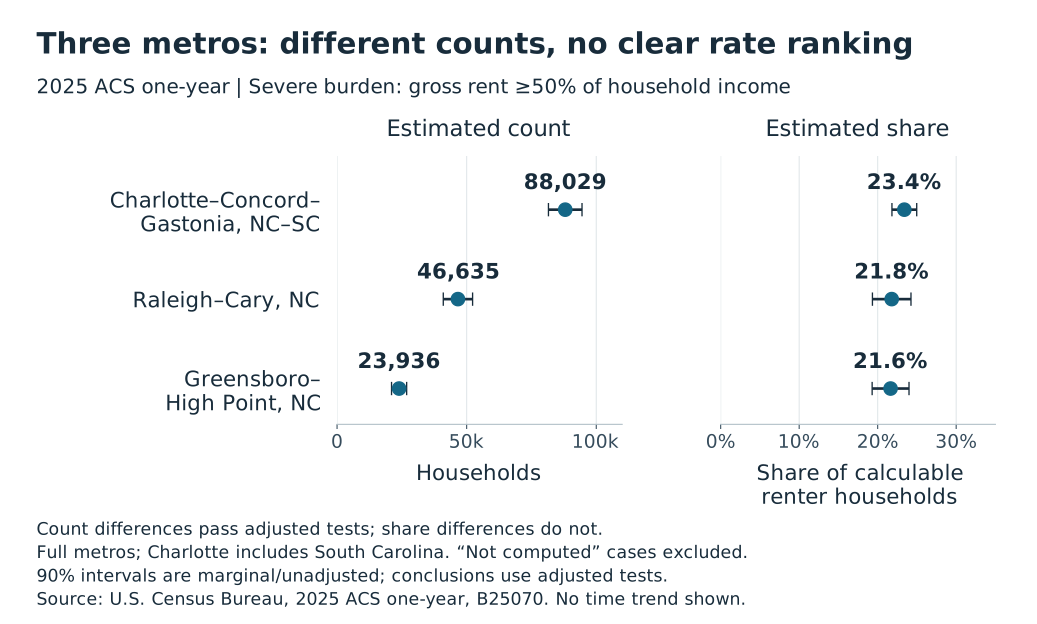
A comparison of Charlotte, Raleigh and Greensboro shows why both counts and shares matter. The Charlotte metro had an estimated 88,029 severely burdened renter households, compared with 46,635 in Raleigh and 23,936 in Greensboro. Those differences in counts were statistically distinguishable in the study’s adjusted tests. The estimated shares, about 22% to 23%, were not clearly distinguishable.
These are three local views of one regional study covering Florida, Georgia and North Carolina and 53 full metropolitan areas touching those states. The findings describe 2025, not current asking rents or conditions measured in 2026. The Census Bureau released the estimates on October 29, 2026. The analysis does not establish that the seven focal burden shares increased or decreased from 2024 after adjustment for multiple comparisons. Release details
How rent burden is measured
The study calls a household “burdened” when gross rent accounts for at least 30% of household income and “severely burdened” when it accounts for at least 50%. Gross rent includes contract rent and applicable utilities and fuels. All percentages exclude households whose rent-to-income ratio the Census Bureau reports as “Not computed,” including no-cash-rent units and households with zero or net-loss income. Exclusion does not mean a household is financially secure.
The figures count renter households or occupied housing units, not individual renters. The age measure is the age of the householder, the person in whose name the home is owned or rented, rather than the age of every resident. The income categories refer to total annual household income, not individual salaries.
Charts show approximate 90% confidence intervals. These describe sampling uncertainty under the study’s calculation method. They are not guarantees and do not account for every possible source of survey error. The methodology appendix explains the separate adjustment used when testing multiple comparisons.
Florida households with older householders had higher burden rates
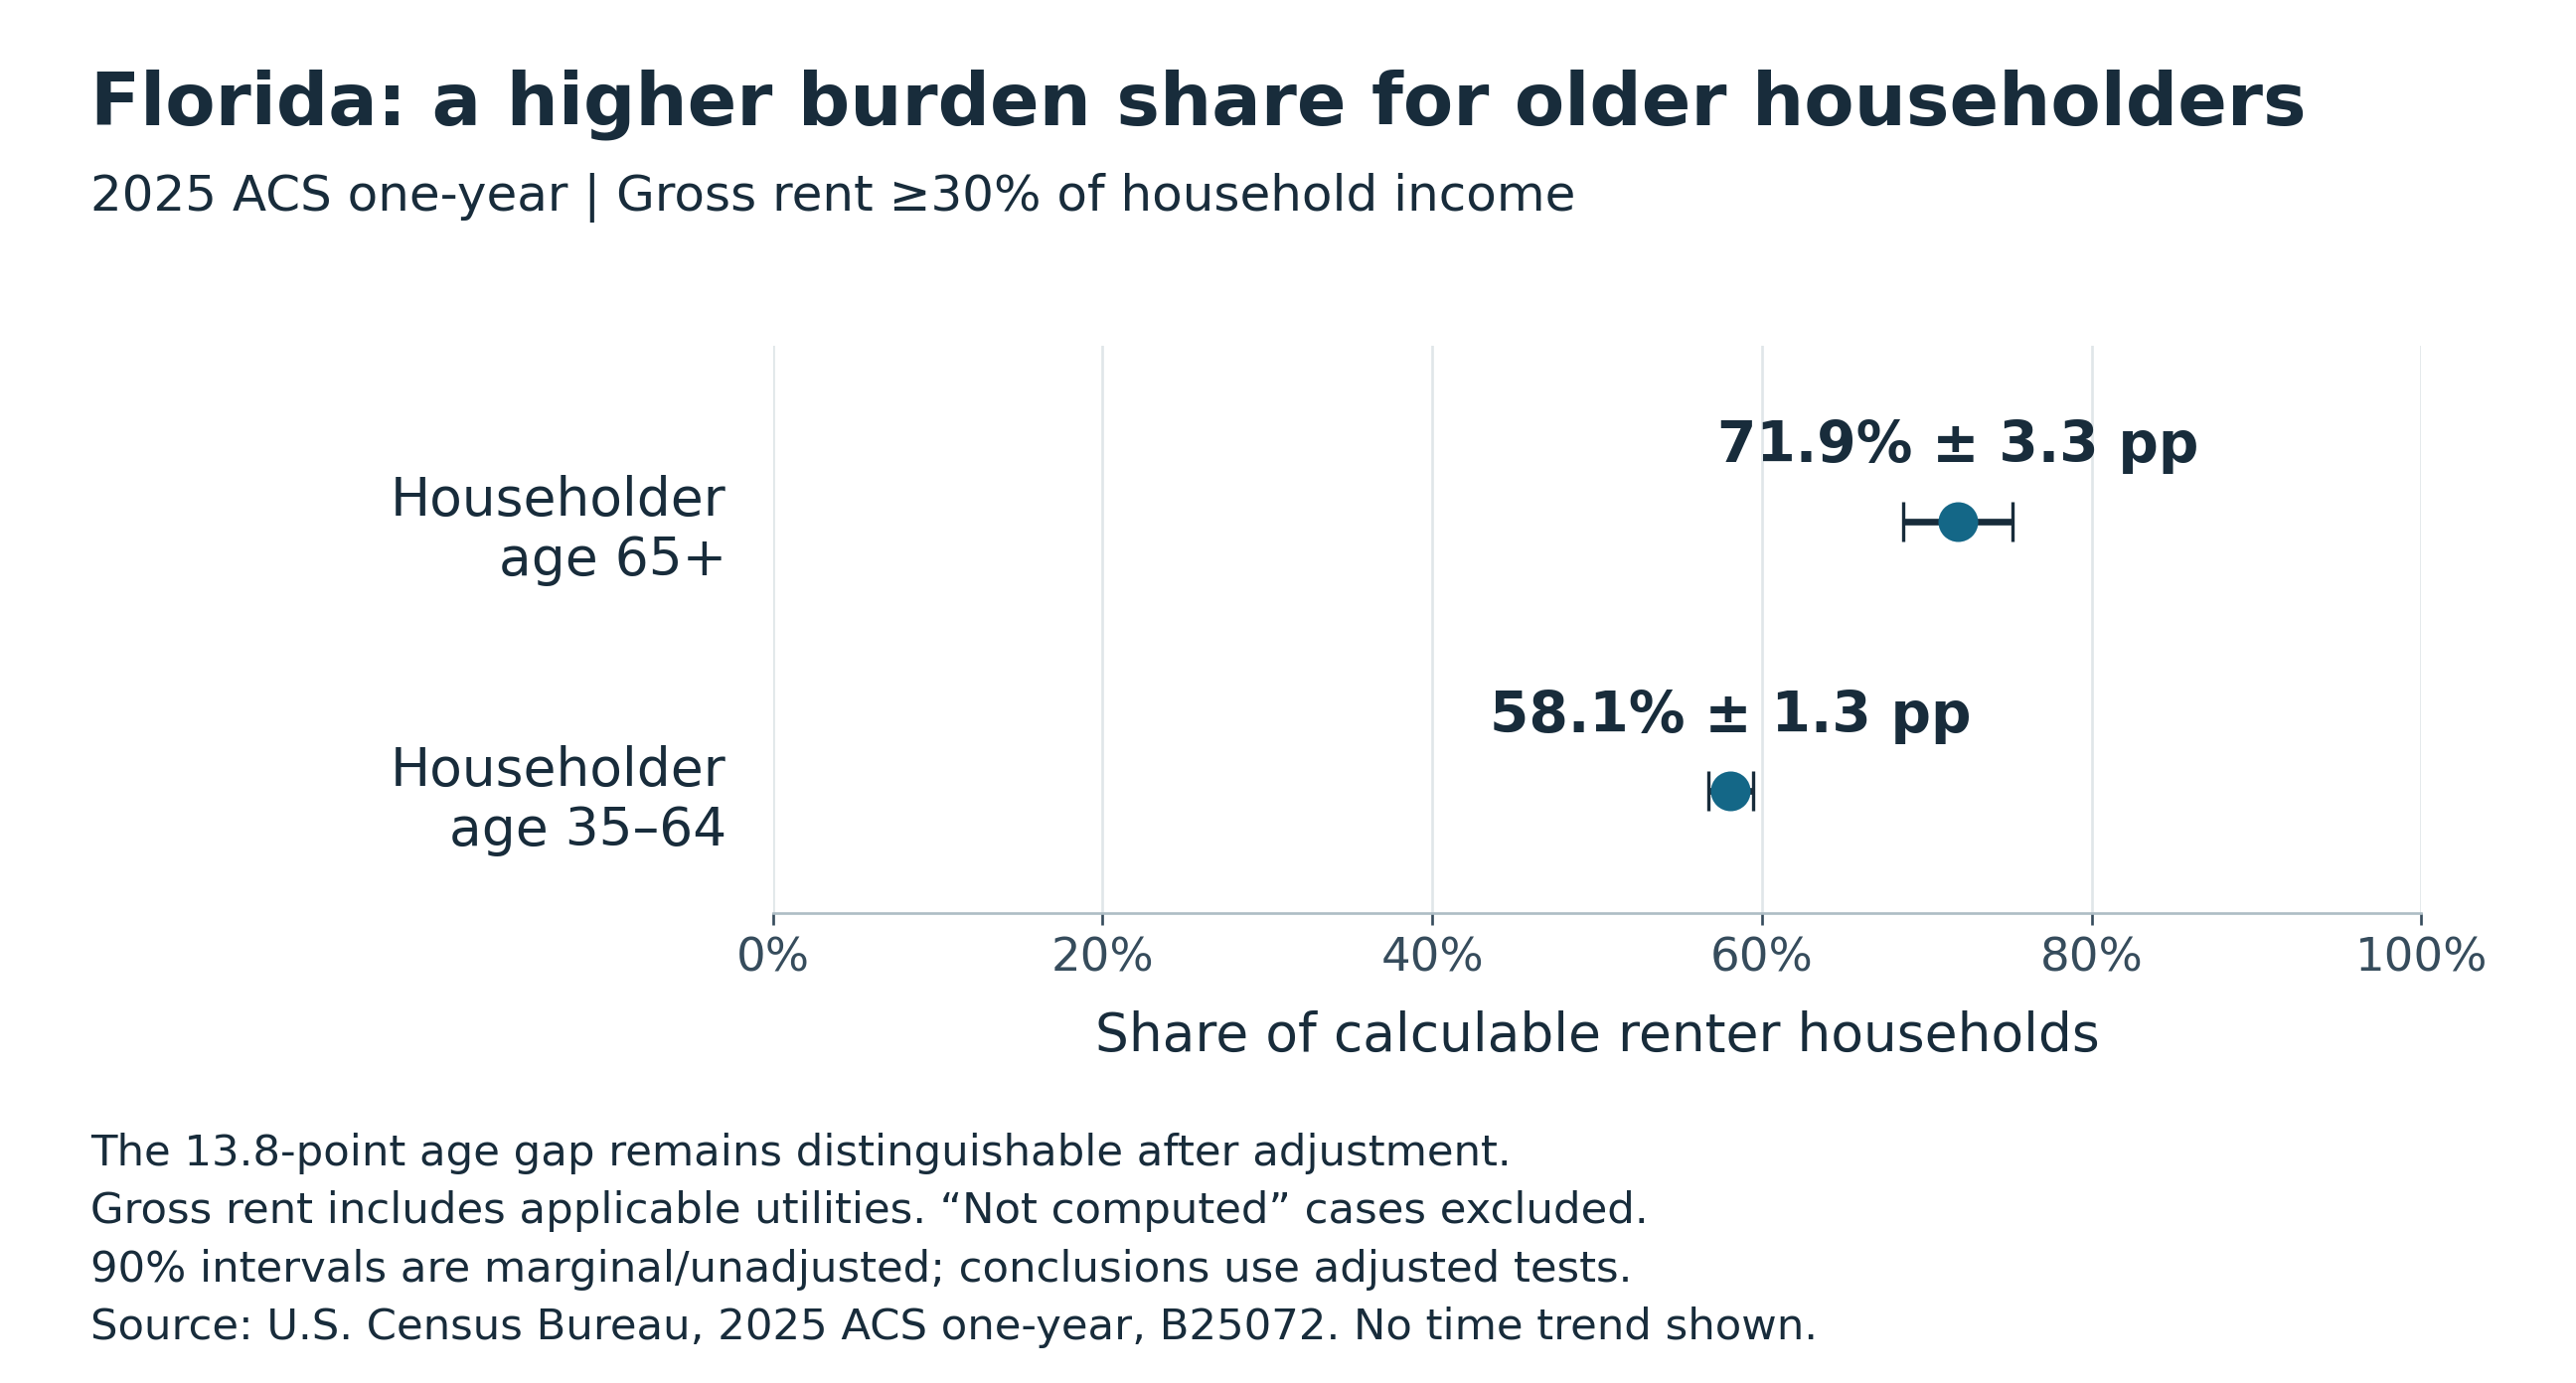
In Florida, an estimated 353,397 renter households with householders age 65 or older spent at least 30% of household income on gross rent in 2025. That was 71.9% of the 491,734 households in this age group with a calculable ratio. The approximate 90% margin of error was 3.3 percentage points.
Among households with householders ages 35–64, the corresponding estimate was 805,761 households, or 58.1% of 1,386,842 calculable households, with a margin of 1.3 points. The older group’s 13.8-point higher estimated rate remained statistically distinguishable after the study adjusted for its full set of Florida age comparisons. It also passed a more conservative uncertainty sensitivity check.
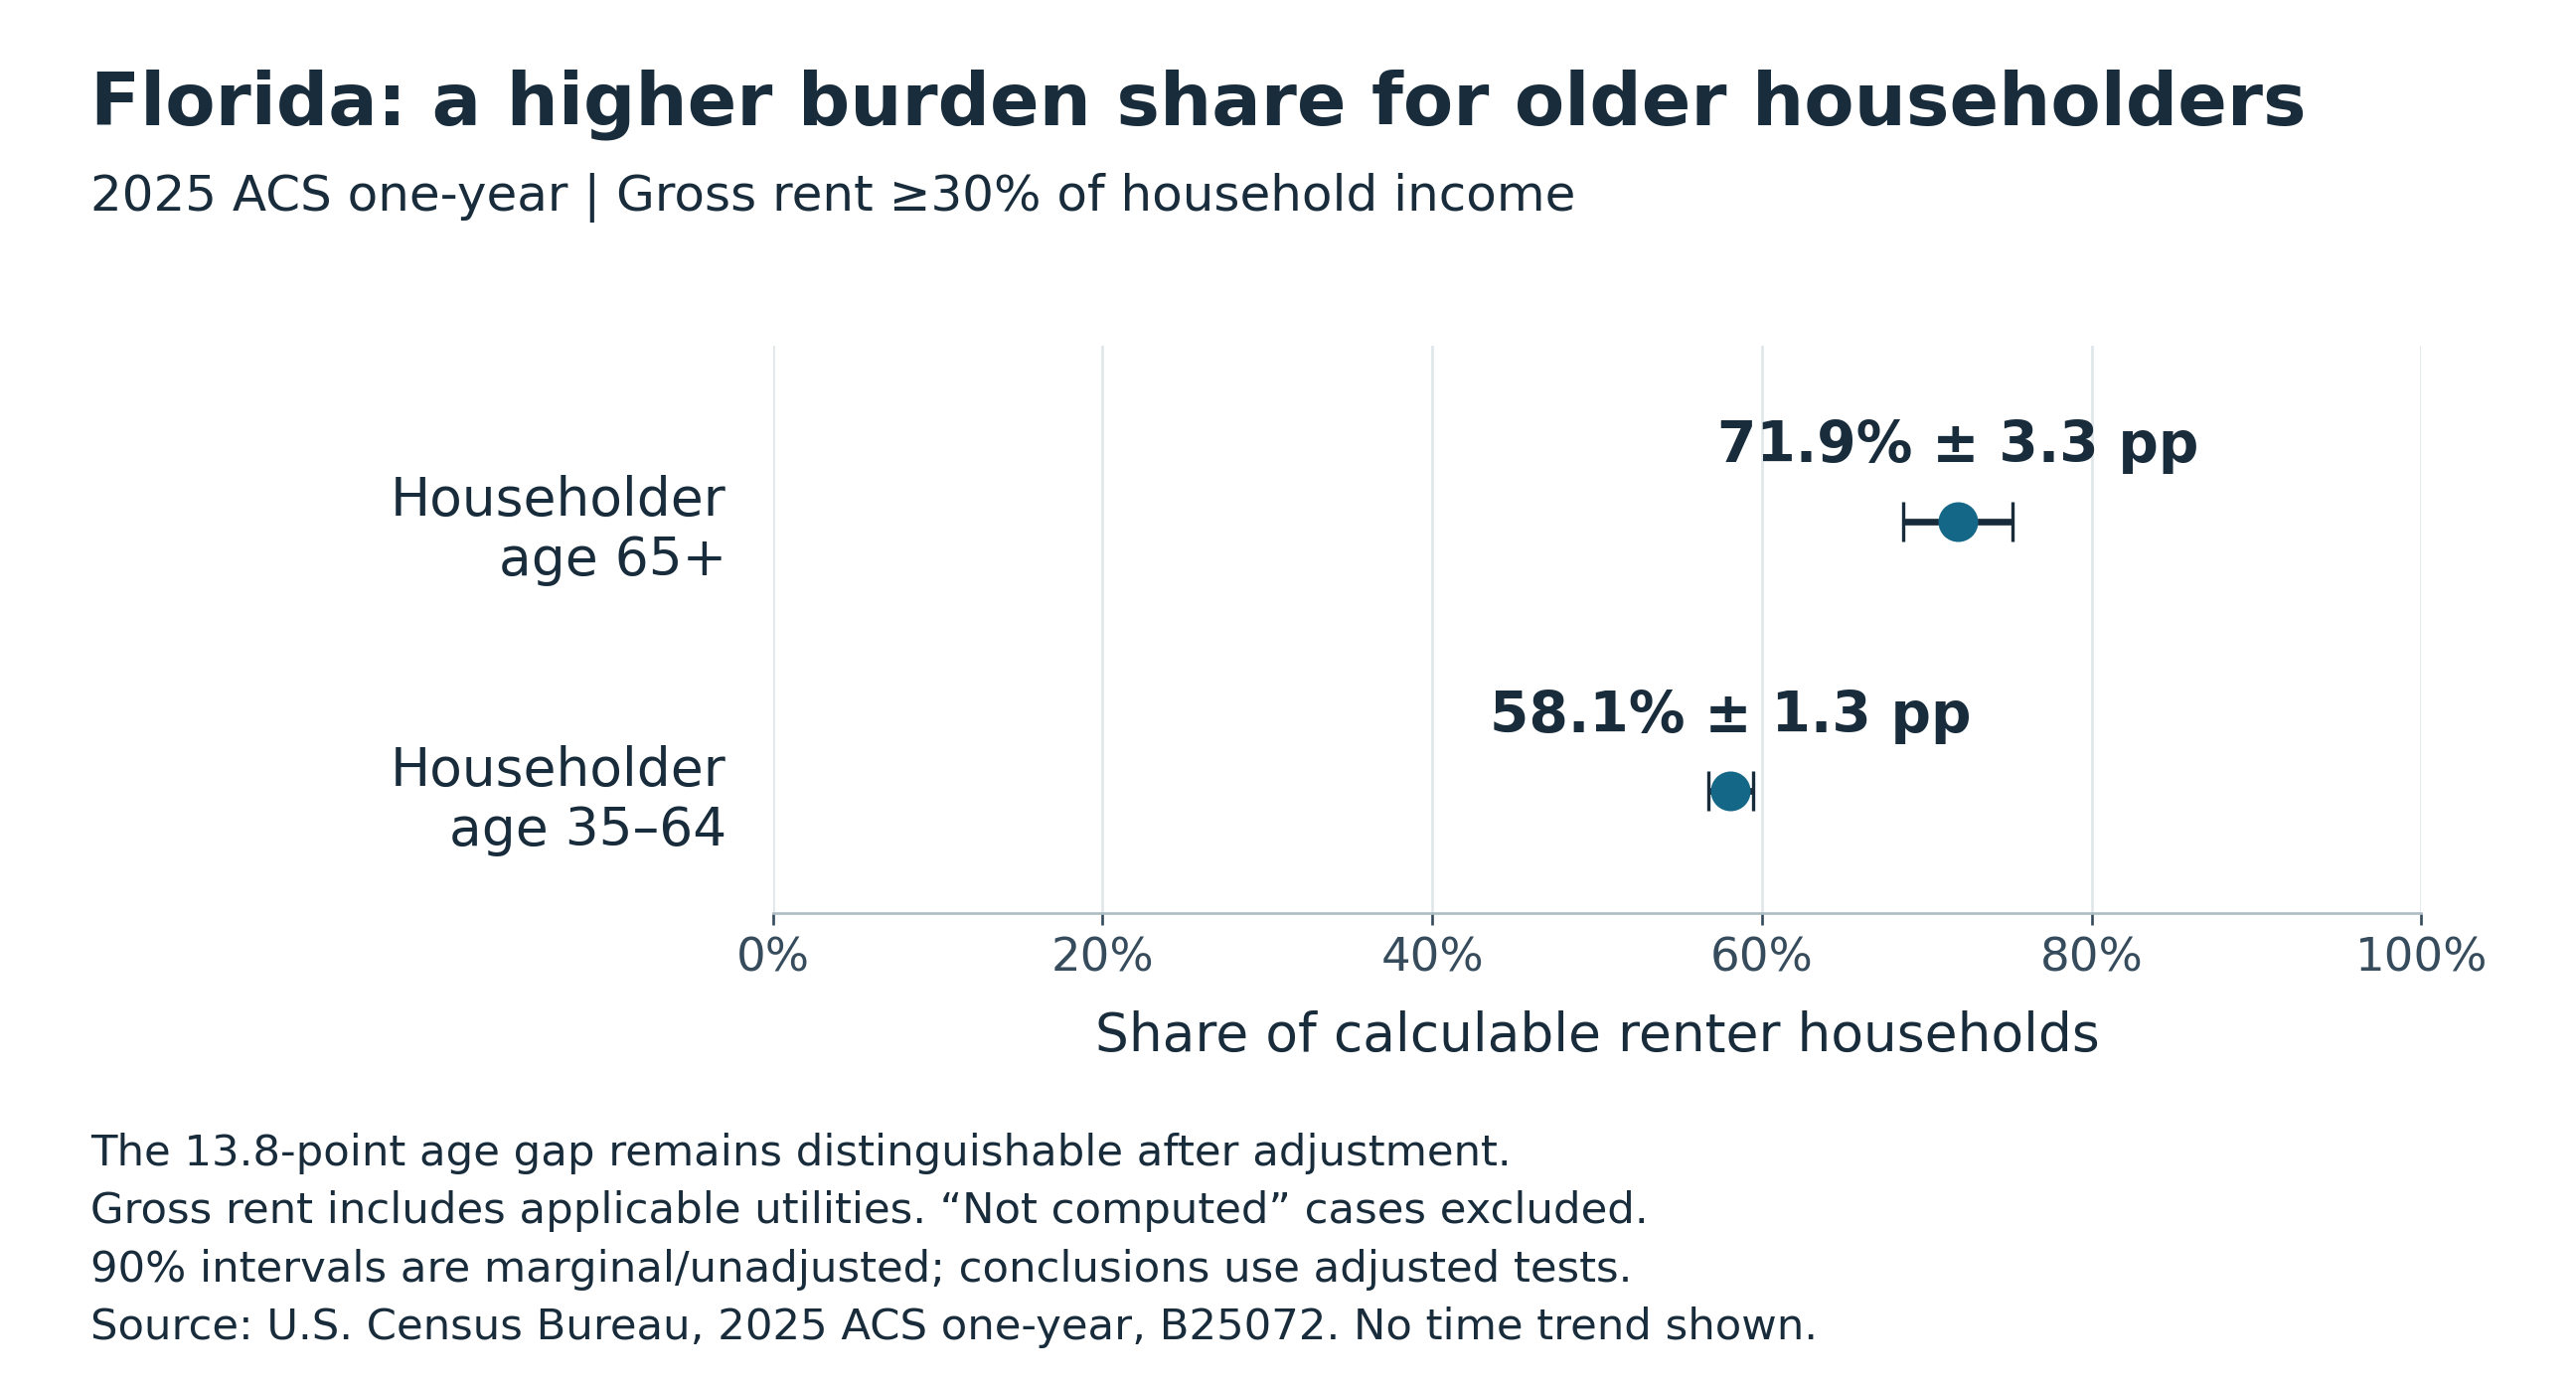
The comparison describes a difference between age groups in one year. It does not show that aging or retirement caused the difference, and the table does not identify retirement status. It also cannot measure severe burden by age because its highest category is 35% or more of income.
The older group included another 57,164 households without a computed burden ratio. The ages 35–64 group excluded 80,105. Those households remain part of Florida’s renter population, although they cannot enter these percentage calculations.
Most Atlanta renter households in the two income bands were burdened
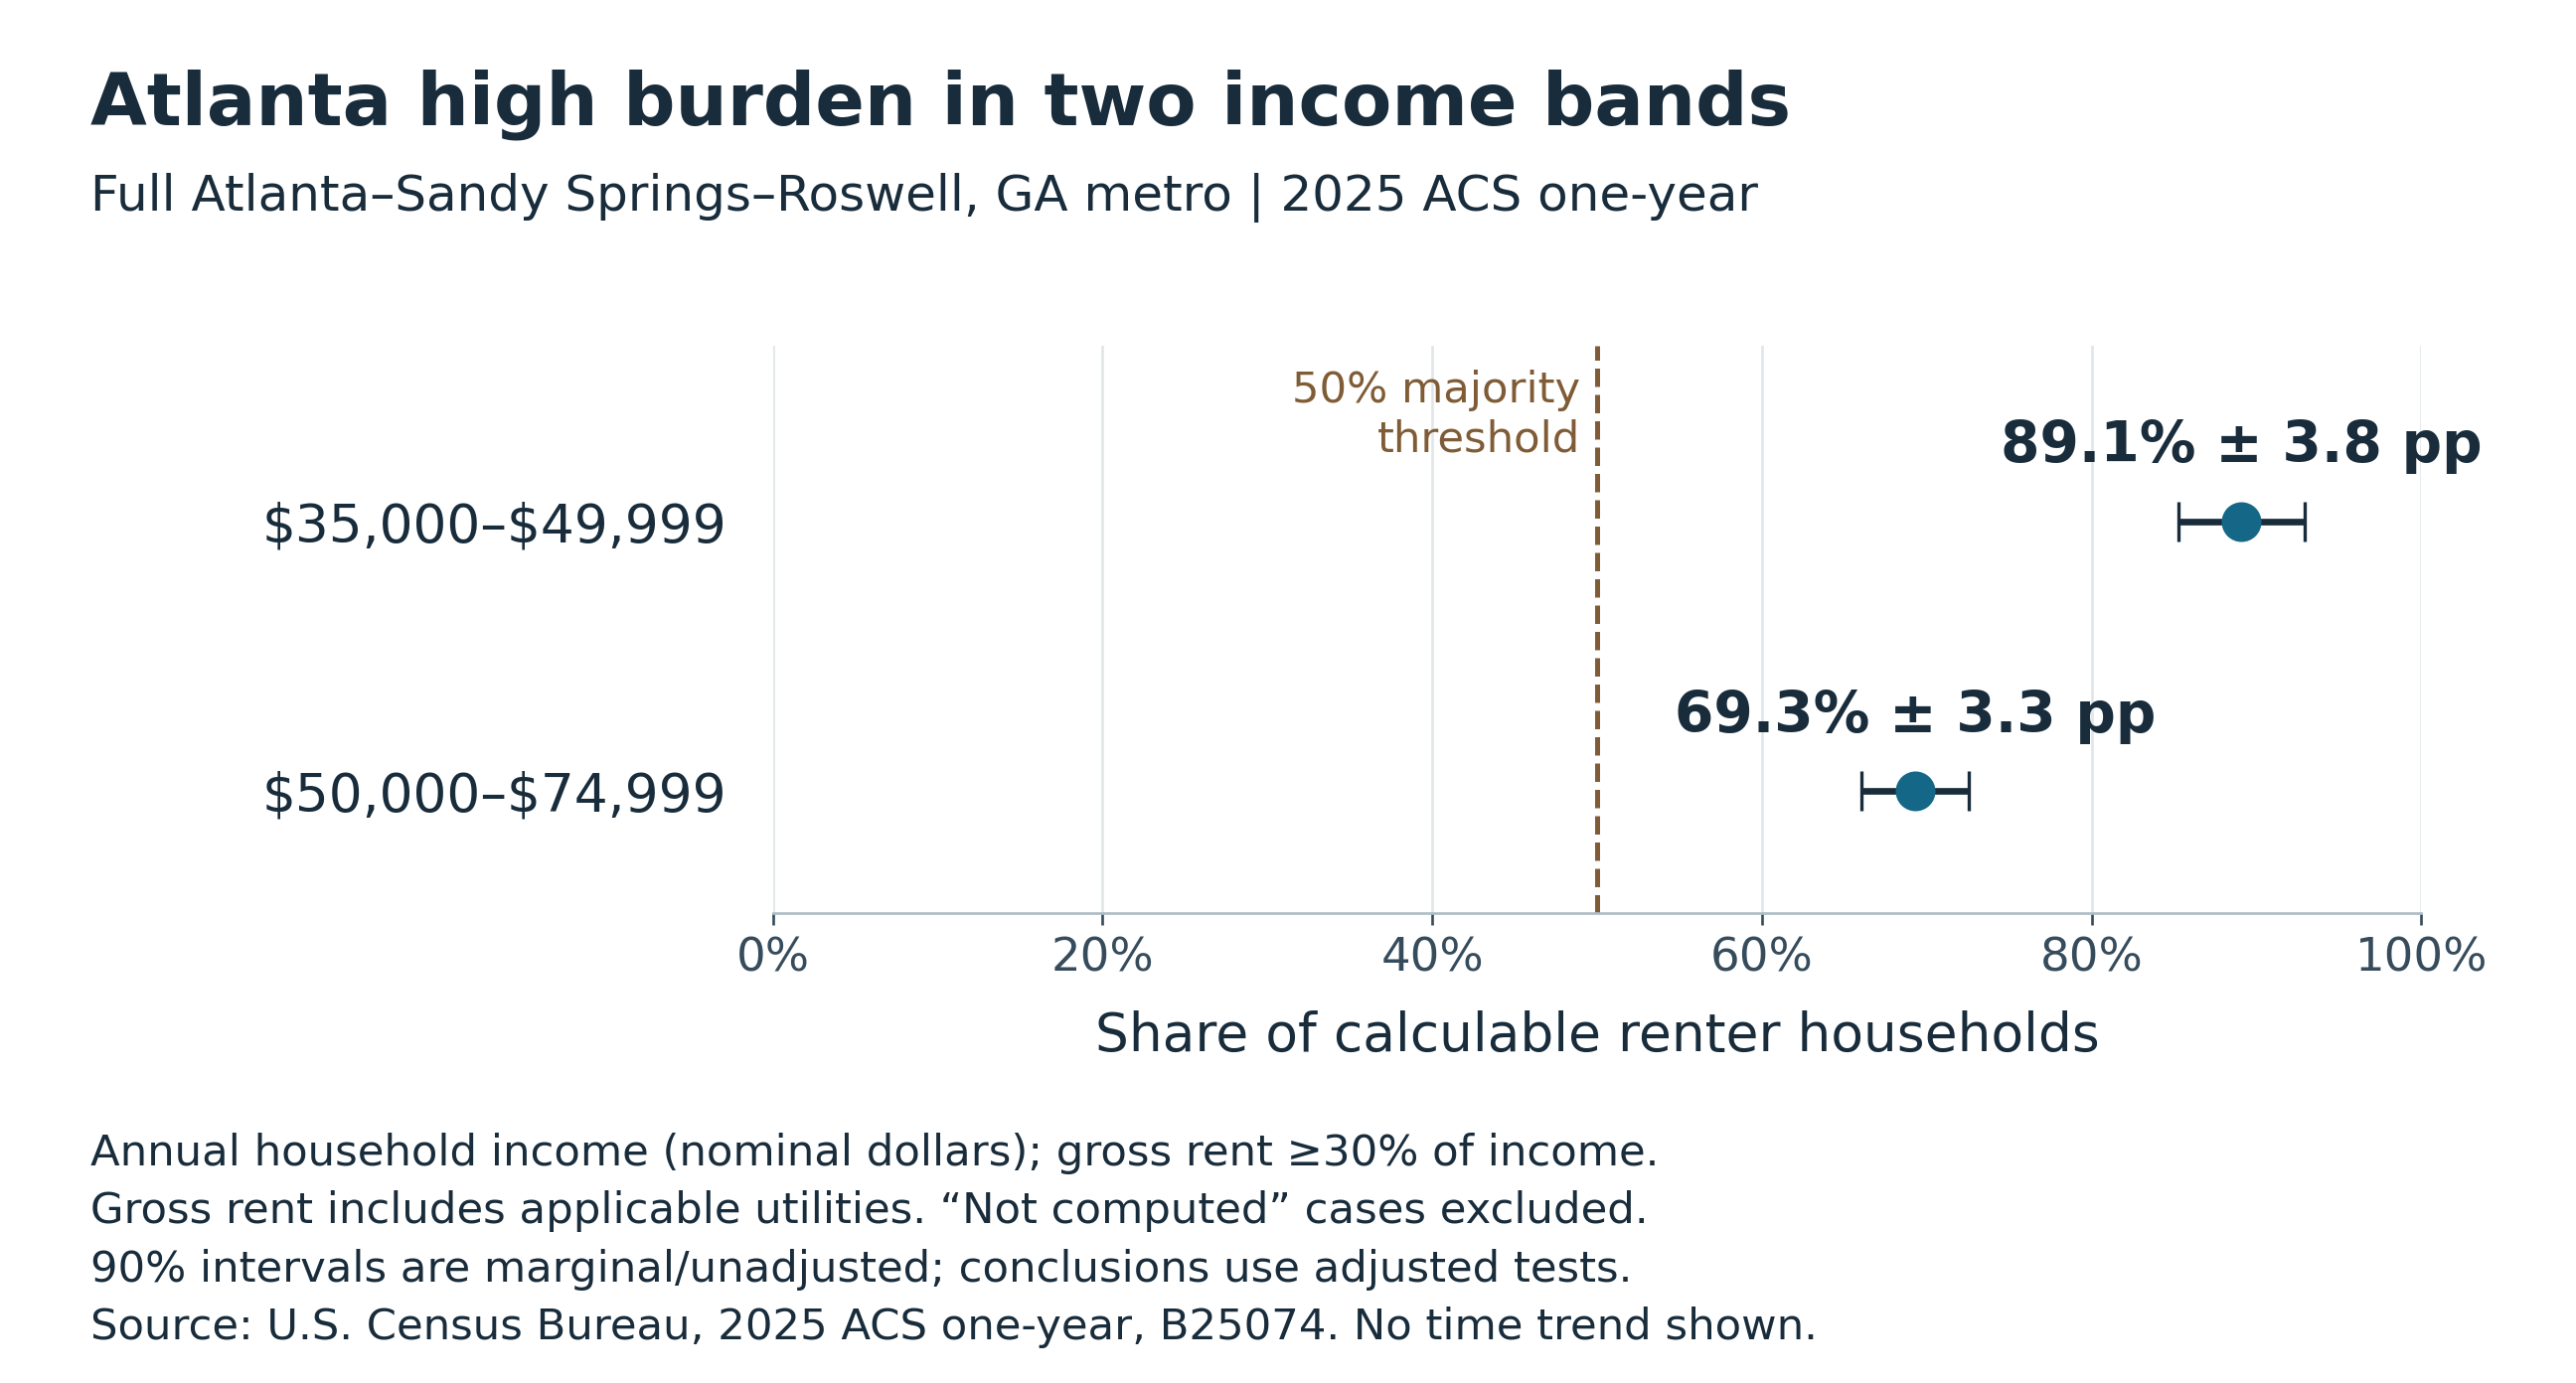
In the full Atlanta–Sandy Springs–Roswell metropolitan area, 89.1% of calculable renter households with annual household income of $35,000–$49,999 spent at least 30% of income on gross rent in 2025. That represents an estimated 84,346 of 94,688 households, with a 90% margin of error of 3.8 percentage points.
For households with annual household income of $50,000–$74,999, the estimated share was 69.3%, or 109,807 of 158,457 households, with a margin of 3.3 points. Both estimates were above the 50% majority threshold after adjustment across the original Georgia and Atlanta comparison family. Both findings also passed the conservative uncertainty sensitivity check.
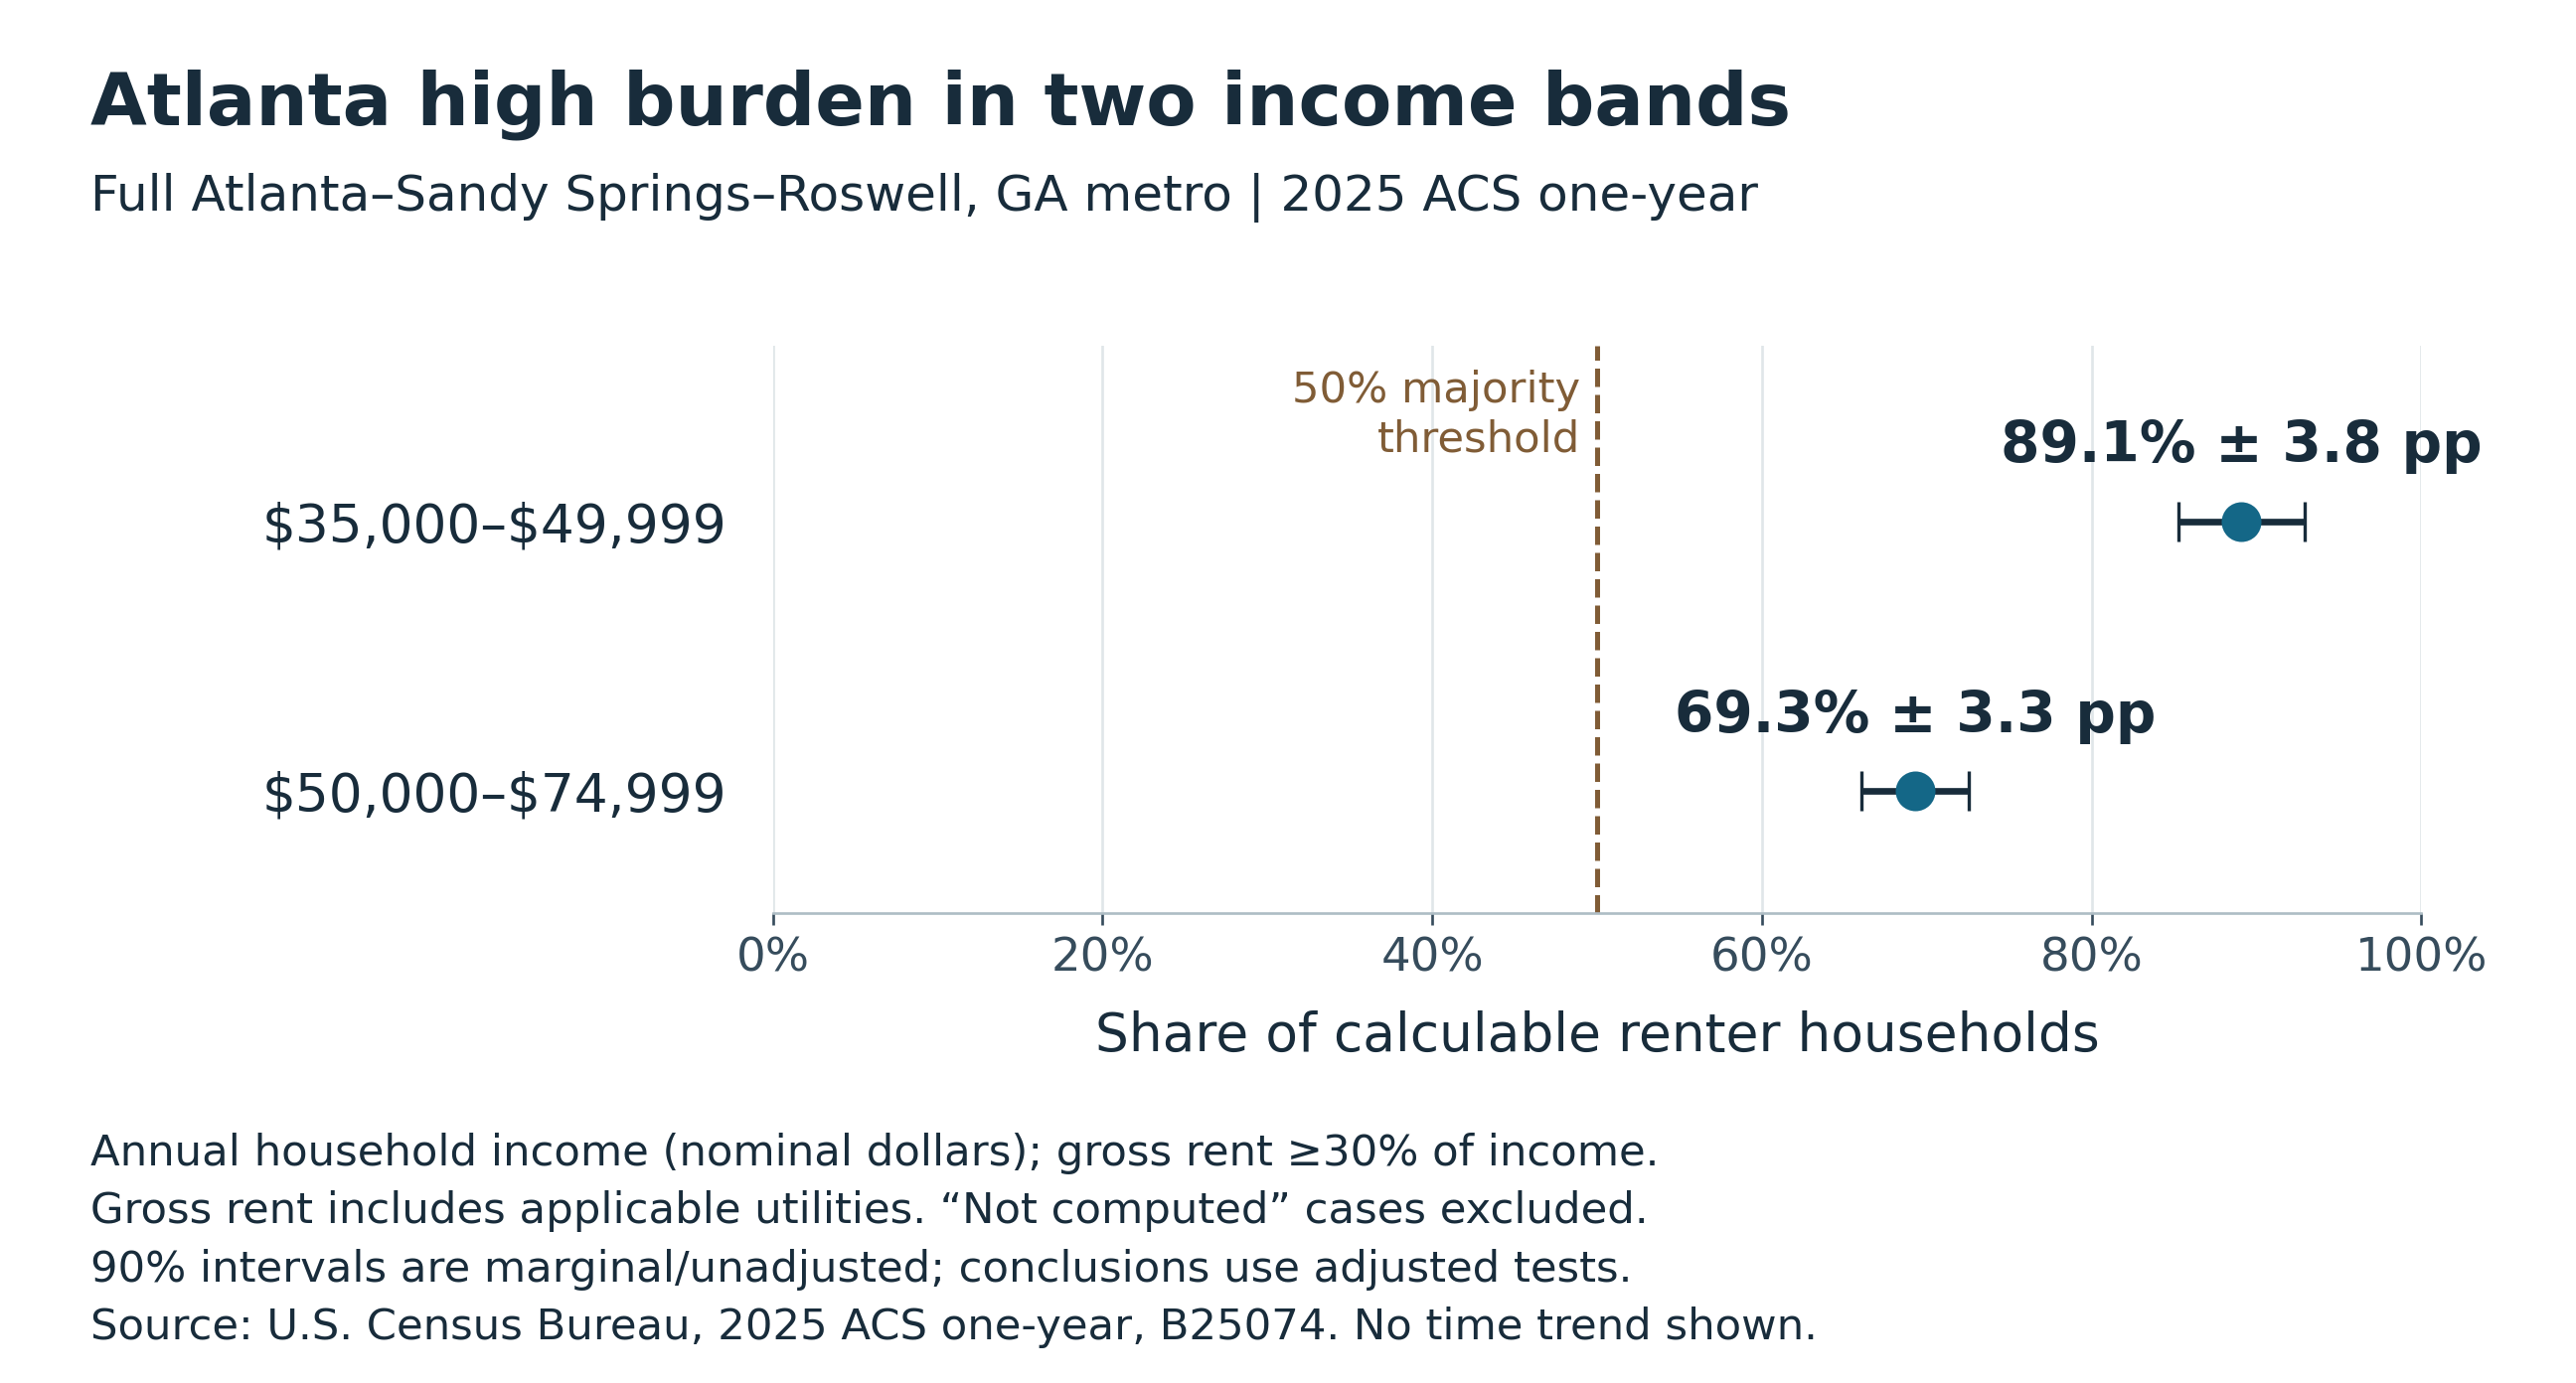
These dollar bands provide a specific view of housing costs relative to income. They are not area-median-income categories or a universal definition of the middle class. The lower band excludes 4,015 households without computed ratios, and the higher band excludes 2,151.
This same-year result should not be read as evidence of an annual improvement or deterioration. Beyond statistical uncertainty, a documented transfer of territory from Lumpkin County to Union County means the published Atlanta metro footprints are not strictly constant between the 2024 and 2025 boundary vintages. The size of the affected territory and household population has not been quantified here.
Charlotte Raleigh and Greensboro show why counts and shares differ
Severe rent burden affected an estimated 88,029 households in the Charlotte–Concord–Gastonia metro in 2025, with a 90% margin of error of 6,475 households. The estimates were 46,635 ± 5,655 in Raleigh–Cary and 23,936 ± 2,915 in Greensboro–High Point.
Charlotte also had the largest calculable renter-household denominator of these three metros: 376,269, compared with 214,054 in Raleigh and 110,594 in Greensboro. Its larger number of severely burdened households therefore needs to be read alongside the size of its renter population.
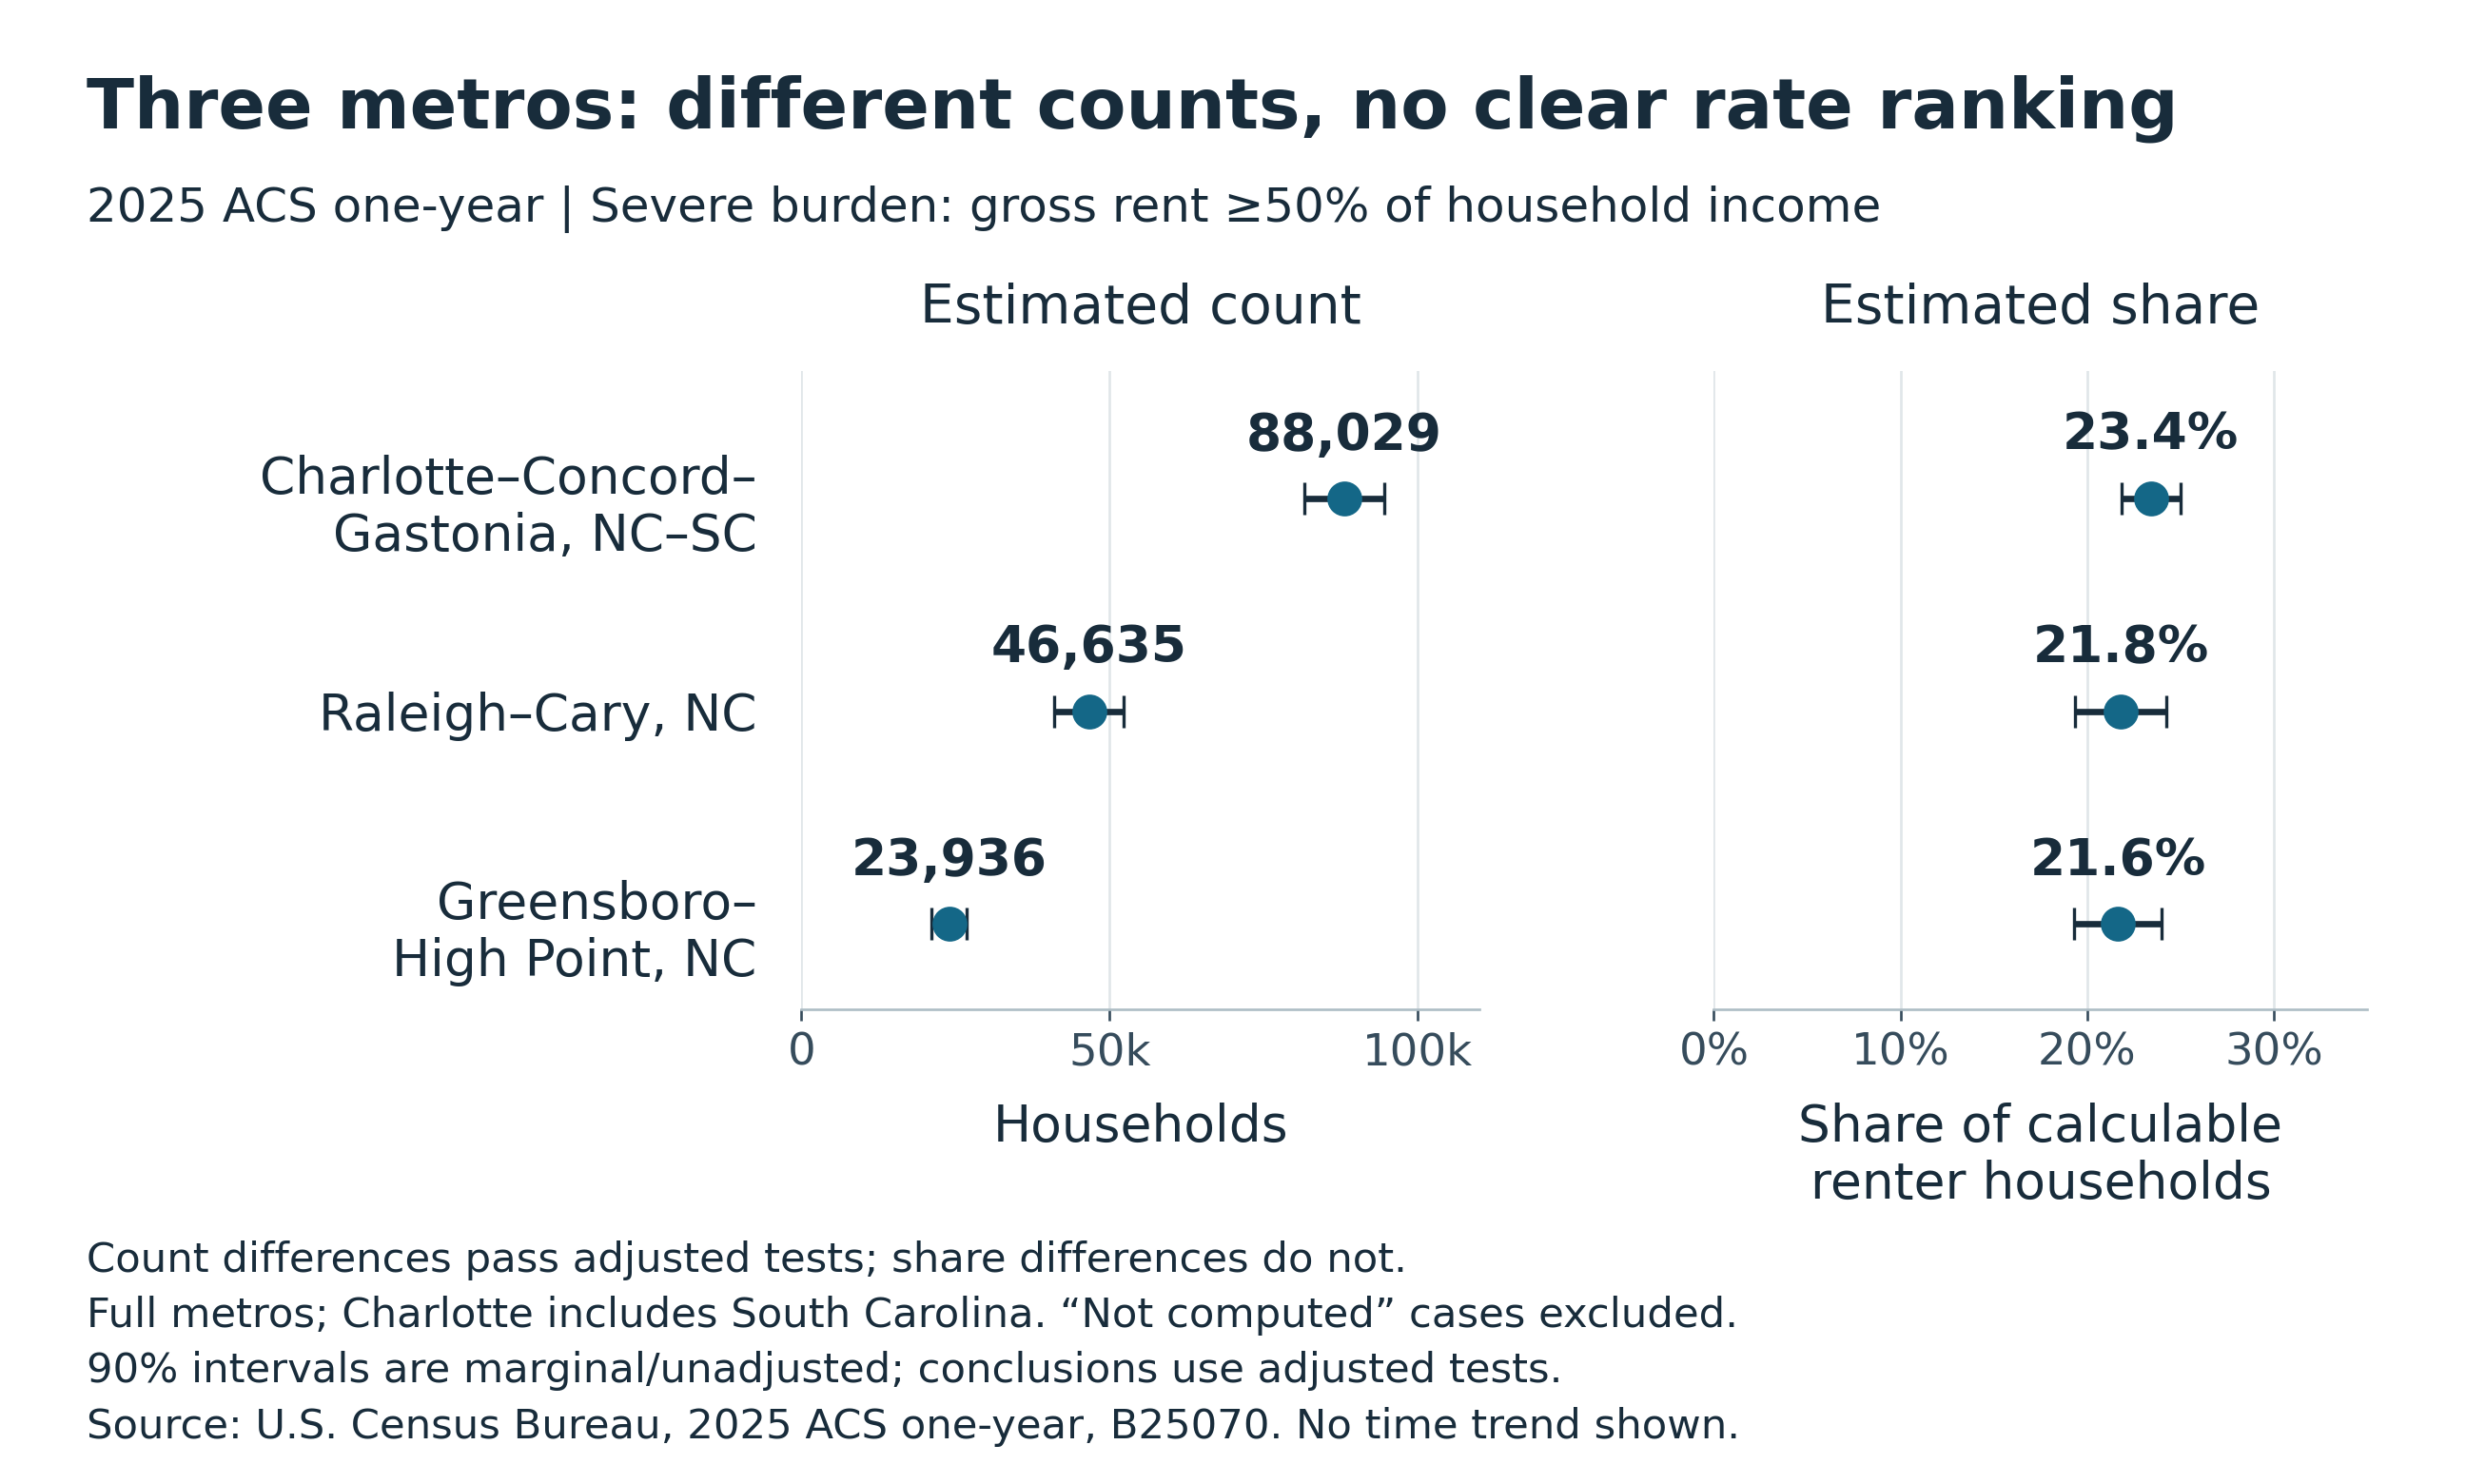
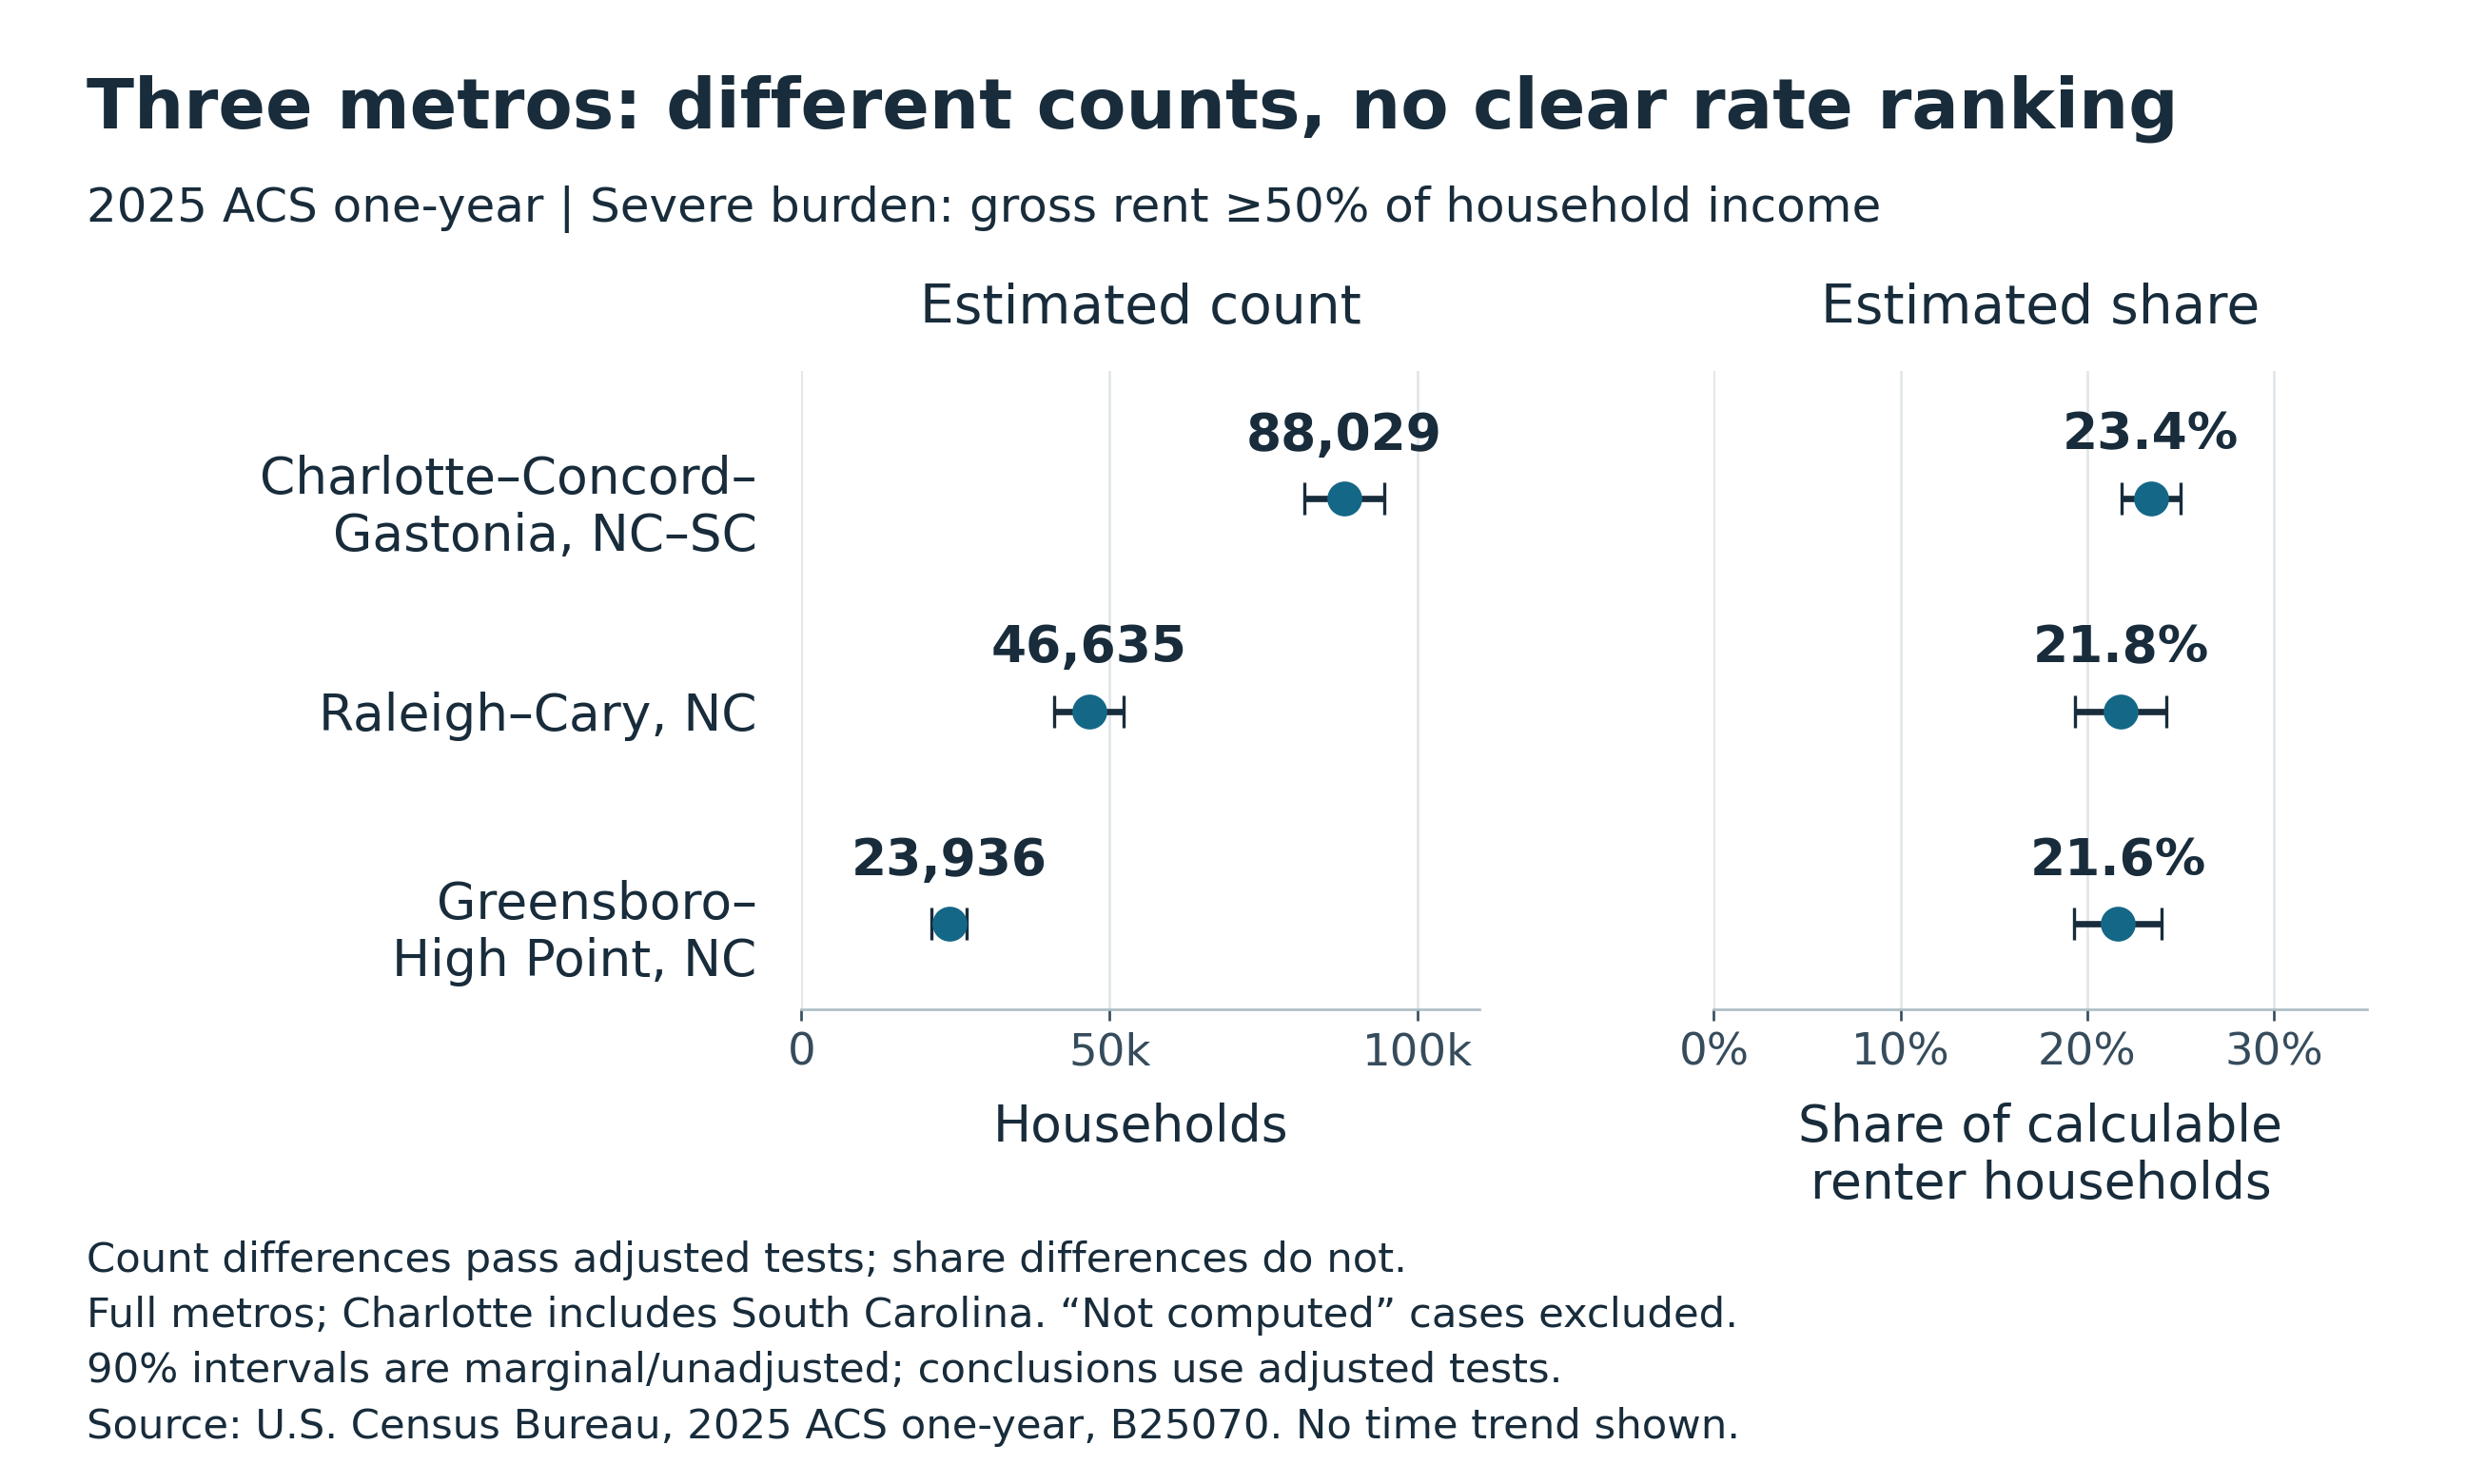
The estimated severe-burden shares were 23.4% in Charlotte, 21.8% in Raleigh and 21.6% in Greensboro. Their approximate 90% margins were 1.6, 2.5 and 2.3 percentage points, respectively. All three pairwise differences in counts passed the study’s adjusted tests. None of the pairwise differences in shares did.
That does not prove the true shares were equal. It means this analysis does not support a confident rate ranking among the three metros. Counts describe how many households face severe burden; shares describe how common it is within the calculable renter population. Both measures are useful, but they answer different questions.
What the estimates can tell us
The 2025 findings identify a higher burden rate among Florida households with older householders, majority burden in the two specified Atlanta income bands, and different scales of severe burden across three North Carolina metros. They do not measure eviction, homelessness, current market rents or the effects of a particular policy.
Census reports that the 2025 survey experienced collection disruptions affecting sample size and precision, used updated population controls including age corrections, and changed disclosure procedures. These factors warrant care in interpretation, especially when comparing years. Weighting changes can also influence within-year subgroup estimates, although this analysis does not quantify an effect on the Florida age gap.
The accompanying methodology, source links and downloadable data document the definitions, exclusions and uncertainty behind each finding. Together, they allow readers to assess housing costs without treating an estimate as an exact count or a small difference as an established trend.
Methodology and source notes
Data and reference period
The main findings use the U.S. Census Bureau’s 2025 American Community Survey one-year detailed tables B25070, B25072 and B25074. The source files were retrieved and frozen on November 9, 2026. The estimates were released October 29, 2026 and describe the 2025 survey period. They are not a November 2026 measurement of rent.
The research also recalculated the corresponding 2024 tables to assess annual comparisons. Census permits comparisons of gross rent as a percentage of household income between these releases. The relevant table universes, labels and row structures matched across years. Table availability and other methodological conditions did not remain identical. Readable Census table-definition pages, downloadable raw files and release documentation appear in the source list below.
Geographic scope
The study roster contains Florida, Georgia and North Carolina and 53 full metropolitan statistical areas touching at least one of those states, for 56 geographies. It is not a South Carolina statewide study. Cross-state metros retain their full Census-defined areas. Charlotte includes its South Carolina counties; other cross-state metros in the roster are likewise not restricted to their Florida, Georgia or North Carolina portions. The findings do not describe city limits.
Both releases use the July 21, 2023 metropolitan delineations. State and county legal-boundary reference dates advance from January 1, 2024 to January 1, 2025. Matching metro codes, names and county membership therefore does not prove identical geographic footprints.
Census boundary-change notes document Union County, Georgia, gaining territory from Lumpkin County effective May 1, 2024. Lumpkin is an Atlanta metro county; Union is outside the metro. Atlanta’s published year comparison is consequently not a strictly constant-footprint comparison. The amount of transferred territory and the number of affected households have not been quantified here. The within-2025 comparisons describe the published 2025 metro. The transfer is within Georgia and does not change the state’s external boundary. The documentary review found no additional relevant full-metro exception, but it was not a polygon-level geographic audit.
Definitions and denominator treatment
The underlying universe is renter-occupied housing units, referred to here as renter households. Counts are estimates of households in the population, not numbers of survey respondents or individual people.
Gross rent includes contract rent plus applicable utilities and fuels. Burden is defined as gross rent of at least 30% of household income; severe burden is at least 50%. These thresholds include households exactly at 30% or 50%.
All shares use a denominator equal to the relevant total minus “Not computed.” This category includes no-cash-rent units and households with zero or net-loss income. Such cases cannot be treated as unburdened. The excluded counts are disclosed below so readers can distinguish the calculable subset from the full population in each group.
Householder age describes the person in whose name the home is owned or rented. It does not classify every person in the household and does not identify retirement status. B25072 ends with a category of 35% or more; it cannot establish severe burden by age. B25074’s dollar categories describe nominal annual household income, not individual earnings, constant purchasing power, area-median-income bands or the same households followed over time.
Focal estimates and exclusions
All rows below refer to 2025. “Burdened” means at least 30% for the Florida and Atlanta rows, and at least 50% for the three North Carolina metro rows. Margins of error are at the 90% level. Percentage margins are approximate and expressed in percentage points.
| Group | Burdened households | Calculable households | Not computed | Burden share and MOE |
|---|---|---|---|---|
| Florida householder 65 or older | 353,397 | 491,734 | 57,164 | 71.9% ± 3.3 pp |
| Florida householder ages 35–64 | 805,761 | 1,386,842 | 80,105 | 58.1% ± 1.3 pp |
| Atlanta household income $35,000–$49,999 | 84,346 | 94,688 | 4,015 | 89.1% ± 3.8 pp |
| Atlanta household income $50,000–$74,999 | 109,807 | 158,457 | 2,151 | 69.3% ± 3.3 pp |
| Charlotte–Concord–Gastonia NC–SC | 88,029 | 376,269 | 19,387 | 23.4% ± 1.6 pp |
| Raleigh–Cary NC | 46,635 | 214,054 | 7,930 | 21.8% ± 2.5 pp |
| Greensboro–High Point NC | 23,936 | 110,594 | 6,128 | 21.6% ± 2.3 pp |
The full-precision downloadable data include total, numerator and denominator estimates and their margins of error. Printed estimates are rounded only for display. Counts have sampling uncertainty even where the prose omits a count margin for readability.
Table cells used
The three-digit suffixes below identify rows within the named Census detailed table. The linked table-definition pages explain each cell’s label. Numerators are divided by their listed denominators and multiplied by 100.
- Overall burden: B25070 rows 007, 008, 009 and 010 summed; denominator row 001 minus 011.
- Overall severe burden: B25070 row 010; denominator row 001 minus 011.
- Householder age 65 or older burden: B25072 rows 027 and 028 summed; denominator row 023 minus 029.
- Householder ages 35–64 burden: B25072 rows 020 and 021 summed; denominator row 016 minus 022.
- Household income $35,000–$49,999 burden: B25074 rows 033 through 036 summed; denominator row 029 minus 037.
- Household income $50,000–$74,999 burden: B25074 rows 042 through 045 summed; denominator row 038 minus 046.
Uncertainty and comparison tests
Published Census margins of error are at the 90% confidence level. For a sum or difference of cells, the study approximates the margin of error as the square root of the sum of the squared component margins. This also supplies the denominator margin for total minus not-computed cases.
For a share, the study uses Census’s subset-proportion approximation. Let p be the numerator divided by the denominator. Square the numerator margin of error, subtract p squared times the denominator margin squared, take the square root, and divide by the denominator. Multiply by 100 for a percentage-point margin. If the quantity under the square root is negative, use the corresponding ratio formula with a plus sign instead of the minus sign and flag the result. Florida’s 2025 age-65-or-older estimate uses this fallback; its 3.3-point margin is retained.
Standard errors equal the 90% margins divided by 1.645. Difference tests divide the estimated difference by the square root of the sum of the squared standard errors, using a two-sided normal test. The fixed 50% threshold has no sampling margin. These calculations approximate variances and assume zero covariance across compared groups or years. They do not use survey replicate weights. The subtraction in the subset formula and the fallback formula switch mean a change in the calculated margin is not, by itself, evidence of a change in survey quality.
The study uses Holm adjustment at a 10% significance level within each stated comparison family. This reduces the risk of false findings when several tests are considered together, conditional on the validity of the individual approximate tests. It does not remove survey bias, composition changes or uncertainty about covariance. These are transparent analytical families, not a prospectively registered experiment.
The original 2025 descriptive families were retained in full:
- Florida householder-age gaps: 20 computable comparisons across the state and eligible full metros. The state’s 13.8-point gap passes; its approximate, unadjusted 90% margin is 3.6 points.
- Georgia and Atlanta income-band majority comparisons: four tests, covering two income bands in each geography. Both Atlanta shares pass the comparison with 50%.
- Charlotte, Raleigh and Greensboro severe burden: six tests, comprising all three pairwise share differences and all three pairwise count differences. All count differences pass; none of the share differences passes.
The chart intervals are marginal, unadjusted 90% intervals for individual estimates, not simultaneous intervals for the full test families. The comparison conclusions come from the stated adjusted tests, not from visually judging whether error bars overlap. A finding that is not statistically distinguishable does not establish equality.
Sensitivity and annual comparisons
A conservative diagnostic applied the plus-sign ratio formula to every share in the unchanged 20-test Florida and four-test Georgia/Atlanta families. The Florida state age gap and both Atlanta majority findings still passed. The diagnostic margins were 3.9 points for the Florida gap and 10.2 and 7.3 points for the Atlanta shares in the lower and higher income bands, respectively. This is an alternative uncertainty calculation, not an official replacement for the subset method or a guaranteed design-based upper bound.
For 2024–2025 comparisons, none of the seven focal share changes passed its seven-test Holm adjustment, and none of the three North Carolina metro severe-burden count changes passed its three-test adjustment. These results do not establish that the underlying changes were zero. Atlanta also has the boundary limitation described above.
For transparency, a broader exploratory screen considered 483 computable share changes across the study roster. Under the standard approximation, two declines for householders ages 15–24, in North Carolina and Durham–Chapel Hill, passed that screen’s adjustment. Neither passed when the plus-sign diagnostic was applied to all 483 comparisons. These state and metro populations overlap, the Durham baseline had a relatively wide margin, and the survey’s age controls changed. The study therefore does not present these as established annual trends or public headline findings. They require further variance and household-composition analysis. They do not describe all young people or students; group quarters such as college dormitories are outside the renter-occupied housing-unit universe.
No independent replicate-weight variance estimate was computed. The Census variance-replicate product listed at review covers selected five-year tables, not these 2025 one-year tables. A public-use microdata reconstruction would be a separate analysis with different geography and potential tabulation differences, rather than an exact replacement for the published metro cells.
Coverage and the 2025 survey
Of 56 geographies, B25070 was available for all 56 in both years. B25072 was available for 50 in 2024 and 51 in 2025; B25074 for 31 and 25, respectively. Of 728 potential geography-and-metric rows per year, 529 were computable in 2024 and 491 in 2025, with 483 matched share changes. Unavailable tables are not zero burden. No older five-year estimate was substituted, and missing, blank, suppressed or negative sentinel inputs were not converted to zero. The research did not establish why any particular table became unavailable.
Census’s 2025 user notes identify three relevant changes:
- A six-week appropriations lapse disrupted August–November collection panels, affecting sample size, response and precision. Each year’s published margins were used.
- Revised population controls incorporated age corrections and boundary updates. Weighting changes may affect within-year subgroup estimates as well as annual comparisons. Their specific effect on this study’s age gap has not been quantified.
- Household record swapping was discontinued and some release rules changed. Population thresholds and data-quality rules remained. These changes should not be assumed to explain an individual table’s absence without evidence.
The estimates are descriptive survey findings. They do not establish causes or measure eviction, homelessness, current asking rents, retirement status or policy effects.
Reproducibility
The source manifest records official download URLs, retrieval timestamps, byte counts and SHA-256 hashes. The data files accompanying this study retain unrounded estimates and margins, focal and full comparison results, coverage and the geography roster. Sources were frozen on November 9, 2026 rather than silently mixed with later revisions.
A separate implementation reproduced all 1,020 computed metrics across both years and all 553 computed comparisons. National arithmetic reconciliations matched totals, burden counts and not-computed counts across the 2,224 common geographies in 2024 and 1,998 in 2025. Fresh source downloads matched all ten stored source files. These checks support reproducibility and arithmetic accuracy, not a claim of external peer review or exact survey covariance.
Official source guide
The following Census pages explain the variables and methods in readable form. Raw files are supplied for readers who want to reproduce the calculations. The study’s source freeze is November 9, 2026.
- 2025 ACS one-year release schedule and 2025 summary-file overview. Release timing and access to the table-based files.
- B25070 table definitions and 2025 B25070 raw data. Gross rent as a percentage of household income.
- B25072 table definitions and 2025 B25072 raw data. Age of householder by gross rent as a percentage of household income.
- B25074 table definitions and 2025 B25074 raw data. Household income by gross rent as a percentage of household income.
- 2025 comparison guidance and 2025 table changes. Comparability and table structure.
- Census worked examples for derived estimates and tests. Approximate margins of error and significance testing.
- Collection disruption note, population controls note, and disclosure and release rules note. Changes affecting interpretation of the 2025 release.
- 2024 geography vintages and 2025 geography vintages. Boundary reference dates and metropolitan delineations.
- 2024 national boundary-change notes and July 2023 metro delineation workbook. The Lumpkin-to-Union territory transfer and Atlanta metro membership.
- Variance-replicate table availability. Scope of the published replicate-variance product.
Study, chart and data downloads
The complete public package includes the approved article, methodology, charts, full-precision data, frozen Census source files and reproduction scripts. Preserve its folder layout when extracting. Broader exploratory results are retained for transparency and are not additional headline findings.
- Study and methodology (Word, 831 KB)
- Complete public research package (ZIP, 6.3 MB)
- Seven focal 2025 estimates (CSV)
- Data guide and definitions (Markdown)
- Full methodology and source guide (Markdown)
- All 2024 metrics (CSV)
- All 2025 metrics (CSV)
- Focal annual comparisons (CSV)
- Original 2025 comparison families (CSV)
- 2025 conservative sensitivity checks (CSV)
- 2024 table coverage (CSV)
- 2025 table coverage (CSV)
- Full geography roster (CSV)
- Frozen source URLs, timestamps and checksums (JSON)
- Public package file checksums (JSON)
Reusable charts
Keep each chart with its definitions and caption. Error bars show marginal, unadjusted 90% intervals; conclusions use the stated adjusted comparisons.
- Figure 1: PNG · SVG · Chart data CSV · Caption and alt text
- Figure 2: PNG · SVG · Chart data CSV · Caption and alt text
- Figure 3: PNG · SVG · Chart data CSV · Caption and alt text
Suggested credit: HousingStabilityIQ calculations from U.S. Census Bureau, 2025 American Community Survey one-year estimates, tables B25070, B25072 and B25074. Cite the specific table for each figure.