San Diego solar · 2025 research
San Diego solar use differs by tenure even among one unit homes
HousingStabilityIQ analysis of 2025 American Community Survey estimates
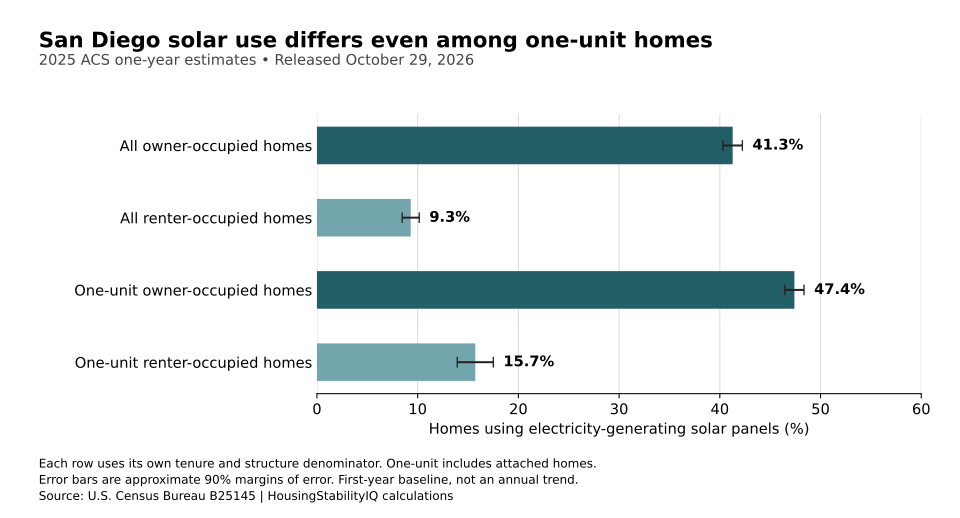
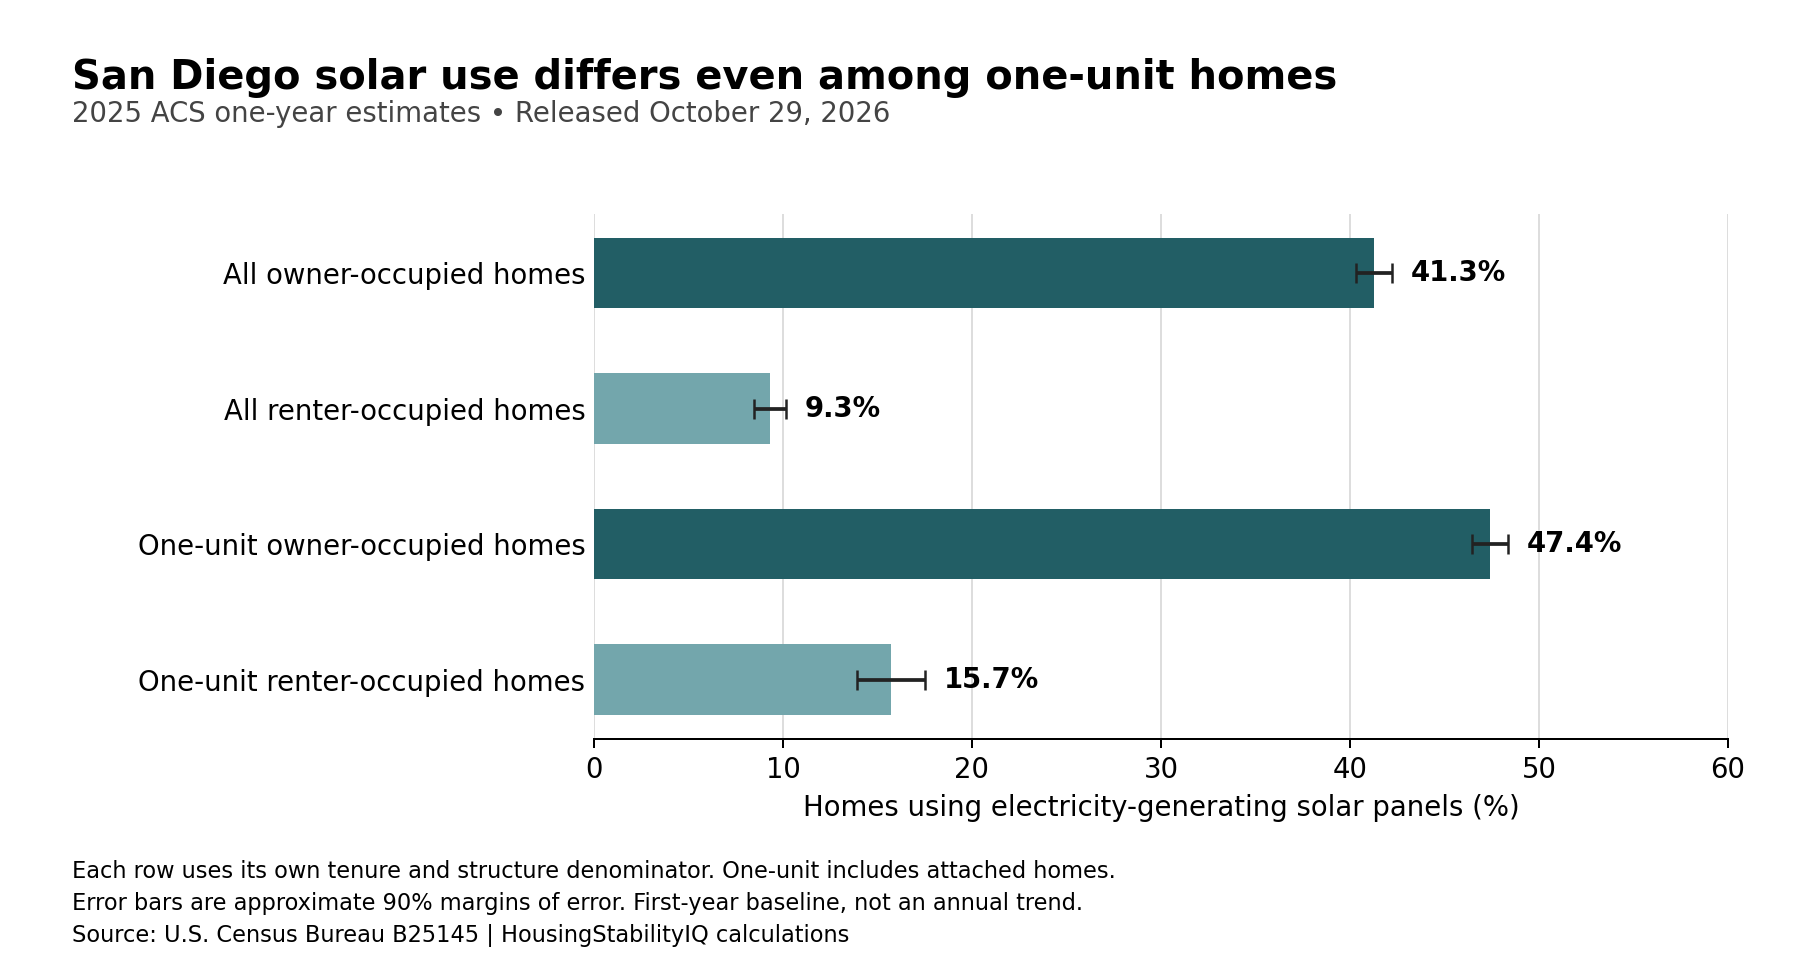
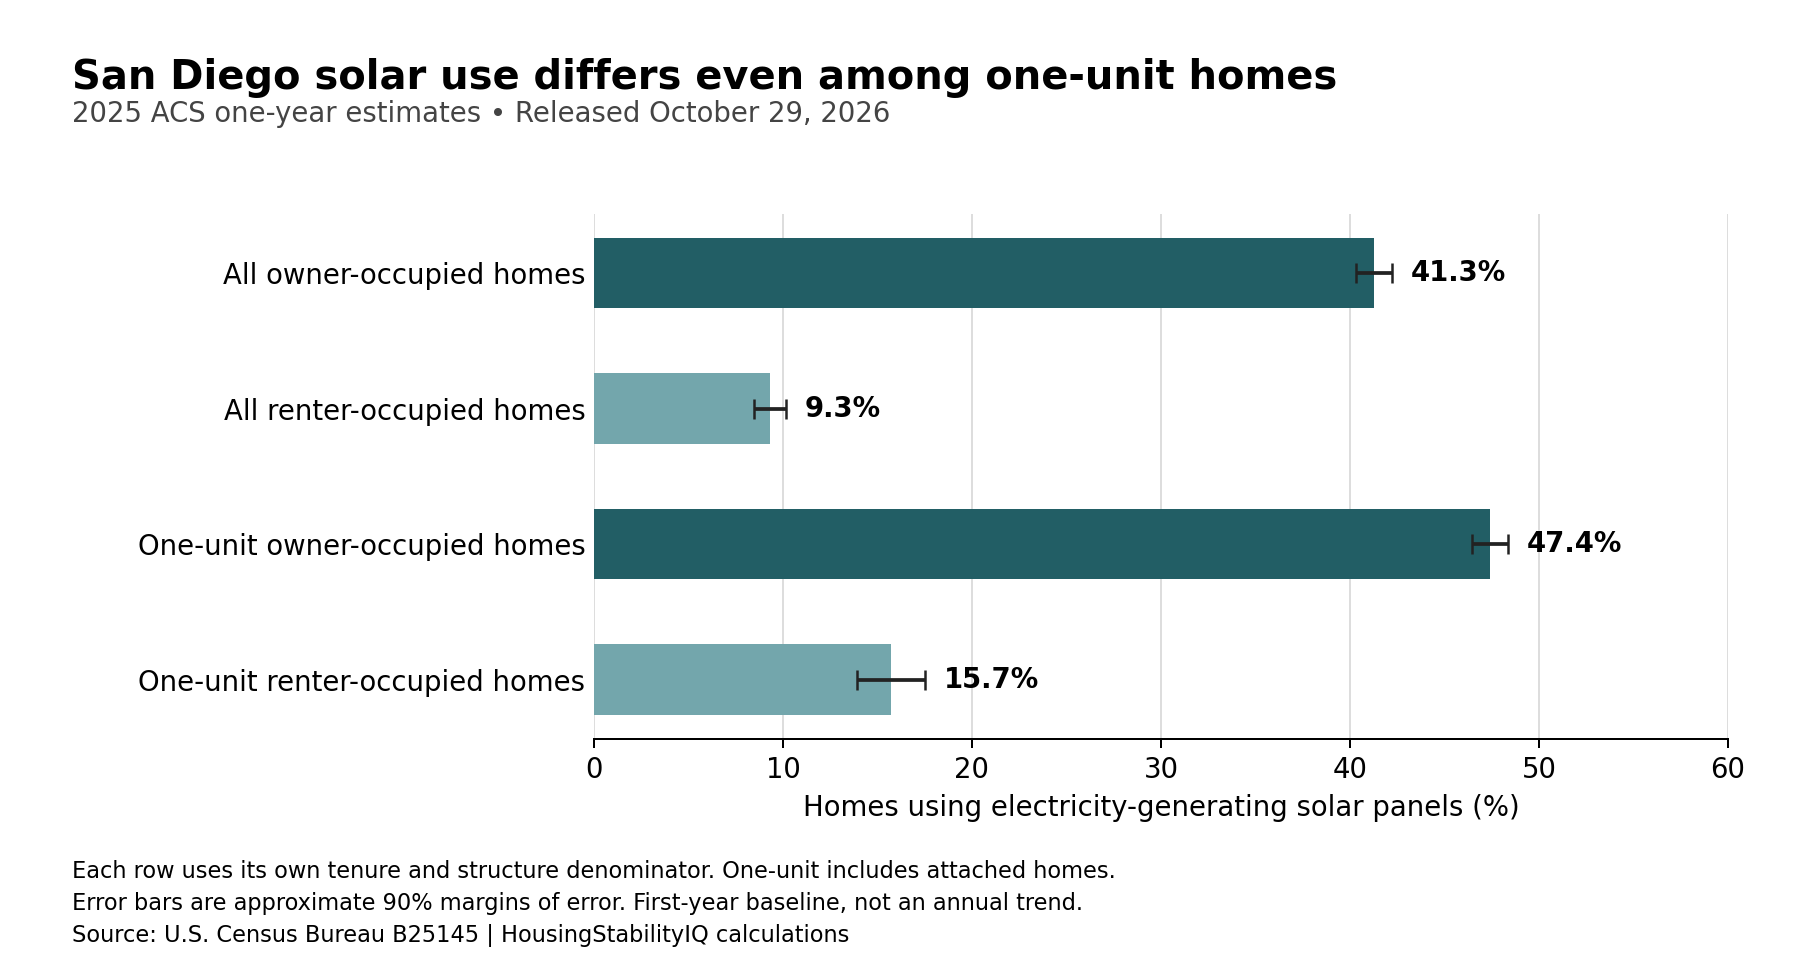
San Diego County’s owner-renter solar divide is not confined to a comparison between houses and apartments. Among occupied one-unit homes, including attached homes, an estimated 47.4% of owner-occupied units used electricity-generating solar panels in 2025, compared with 15.7% of renter-occupied units.
That is a 31.7-percentage-point difference within one broad building category. HousingStabilityIQ calculated the figures from the Census Bureau’s new 2025 American Community Survey table on solar panels, tenure and structure, released October 29, 2026. The approximate 90% margins of error are 1.0 percentage point for owners and 1.8 points for renters in one-unit homes.
The comparison does not isolate the effect of owning rather than renting. Owner-occupied and rented houses can differ in income, age, location and other characteristics that the calculation does not adjust for. But it shows that the countywide tenure difference remains visible when both groups are limited to one-unit housing, rather than comparing owners’ houses with renters’ apartment buildings.
| Group / measure | Estimated households | Denominator | Share ± 90% MOE |
|---|---|---|---|
| All owners · solar | 270,136 | 654,481 | 41.27% ± 0.96 pp |
| All renters · solar | 50,842 | 546,051 | 9.31% ± 0.85 pp |
| One-unit owners · solar | 265,667 | 560,419 | 47.41% ± 0.95 pp |
| One-unit renters · solar | 27,411 | 174,343 | 15.72% ± 1.79 pp |
Scroll the table horizontally on smaller screens. Full-precision values and definitions are in the chart-data CSV and evidence ZIP.
The households behind the percentages
Across all occupied housing types, 270,136 of an estimated 654,481 owner-occupied homes used solar panels, or 41.3%. Among renter-occupied homes, the estimate was 50,842 of 546,051, or 9.3%. Those shares have approximate 90% margins of error of 1.0 and 0.8 percentage point, respectively.
Restricting the calculation to one-unit homes changes both denominators. The owner estimate becomes 265,667 solar-using homes out of 560,419; the renter estimate becomes 27,411 out of 174,343. These are estimated housing units, not counts of panels, installations, people or electricity customers. An apartment building’s shared equipment cannot be translated into a number of individual solar systems from this table.
That distinction matters when discussing household energy expenses. A home’s reported use of solar panels does not show whether its resident owns the equipment, receives particular bill credits or saves money after financing and other charges. Nor does it establish whether the home has battery storage or backup power during an outage.
A new measurement of an established issue
The Census Bureau added the solar question in 2025. It asks whether a house, apartment or mobile home uses panels that generate electricity. This is not the older measure of solar energy as a home’s main heating fuel. There is no comparable 2024 ACS result from this question, so the figures cannot support a claim that the tenure gap widened last year.
Programs already address access for renters. The California Public Utilities Commission’s October 26 description of Solar on Multifamily Affordable Housing explains how participating tenants receive solar bill credits. The countywide ACS estimate is not an evaluation of that program, and a household reporting no solar use should not automatically be labeled ineligible for solar-related benefits.
The new measure also deserves a quality check. Solar information was allocated for 8.7% of all San Diego County housing units in the separate Census allocation table. That includes vacant housing and does not reveal the allocation rate within the owner and renter groups used here. Sampling margins do not capture every possible reporting or processing error.
For local housing reporting, the new contribution is a specific baseline: a large solar-use difference remains within one-unit homes. Explaining why, and whether residents receive affordable energy from the systems serving them, requires more than counting panels.
Methods and interpretation limits
These are ACS one-year research estimates, separate from HousingStabilityIQ’s five-year scores. Approximate 90% margins of error use the Census subset-proportion formula and root-sum-of-squares for component sums or differences; covariance is unavailable. Sampling uncertainty does not include every reporting, coverage or processing error.
Census reports a six-week interruption to 2025 collection, changes to population controls and changes to disclosure processing. These limitations accompany the estimates. Sewer, solar and EV questions are first-year 2025 measures; they do not support a 2024–2025 trend.
Read the full archived methodology. The evidence ZIP preserves frozen source files, source provenance and reproduction scripts.
Sources and context
- 2025 American Community Survey table on solar panels, tenure and structure
- added the solar question in 2025
- October 26 description of Solar on Multifamily Affordable Housing
- Census allocation table
- 2025 Census worked examples
- 2025 subject definitions
- 2025 collection disruption
- 2025 population controls
- 2025 disclosure processing
Data and chart downloads
The evidence download is shared with the related studies that use the same source files. Keep the original folder layout when extracting it. Source and sensitivity records retained for reproducibility do not constitute additional published stories.